ABM
Sebastian Ruiz's Git Hub repository for ABM at William and Mary
Project maintained by Seabass1000 Hosted on GitHub Pages — Theme by mattgraham
Project 1: Modeling the population and geography of Senegal and its districts
I chose to examine Senegal because, with a population of 16 million, it is a relatively populous developing country in West Africa. Furthermore, I became very interested in Senegal’s development when I learned through my initial research that various businesses and humanitarian groups have taken an interest in it due to its rapidly rising population and status as a cultural center in West Africa. Finally, Senegal contains a sizable amount of both rural and urban areas which I thought could make for some insightful analysis.
Creating a Geometric Bar Plot
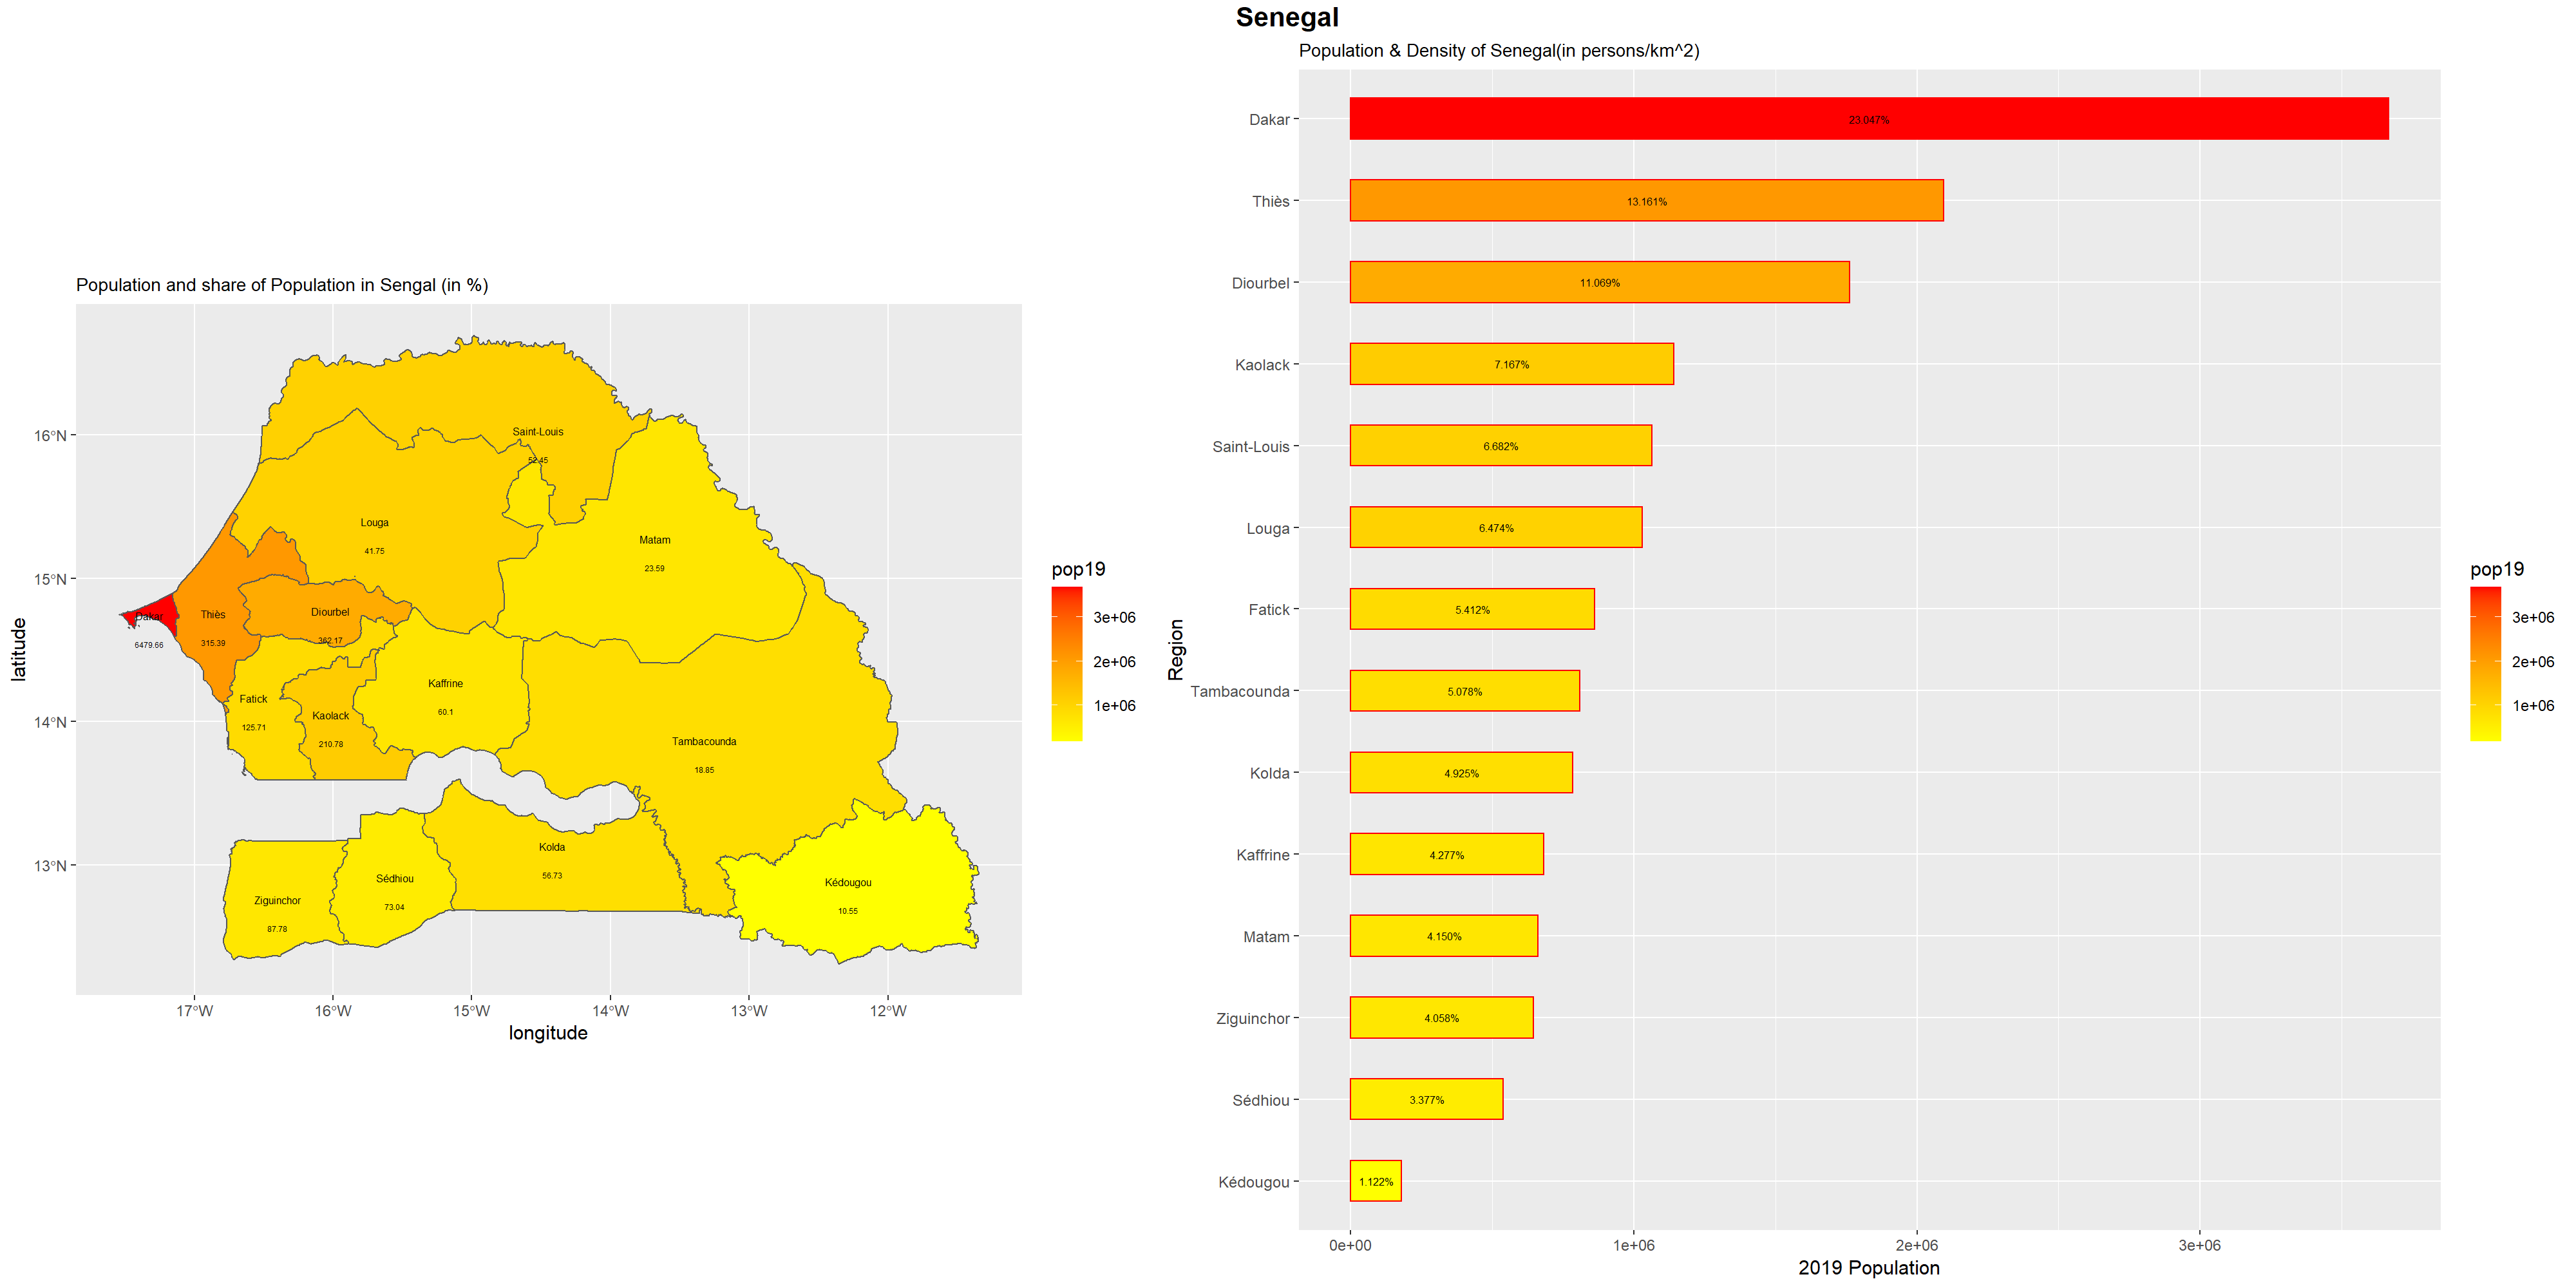
This graphic consists of a geospatial map of Senegal and its regions with a geospatial map containing a heatmap that indicates each region’s population density; and a geometric bar plot of the percent of the population of Senegal that is located in each region sorted from highest to lowest.
This graphic shows that the majority of Senegal’s population is concentrated in the Dakar and Thies regions in the west coast where its capital, also named Dakar, and other largest cities are located while the east side of the country is considerably less populated with kedougou being the least populated region. This makes considering that Senegal probably relies on its port cities its food and economic development.
Stretch goal 1: A Geometric Bar Plot of the Population Distribution of Senegal’s Regions and Districts
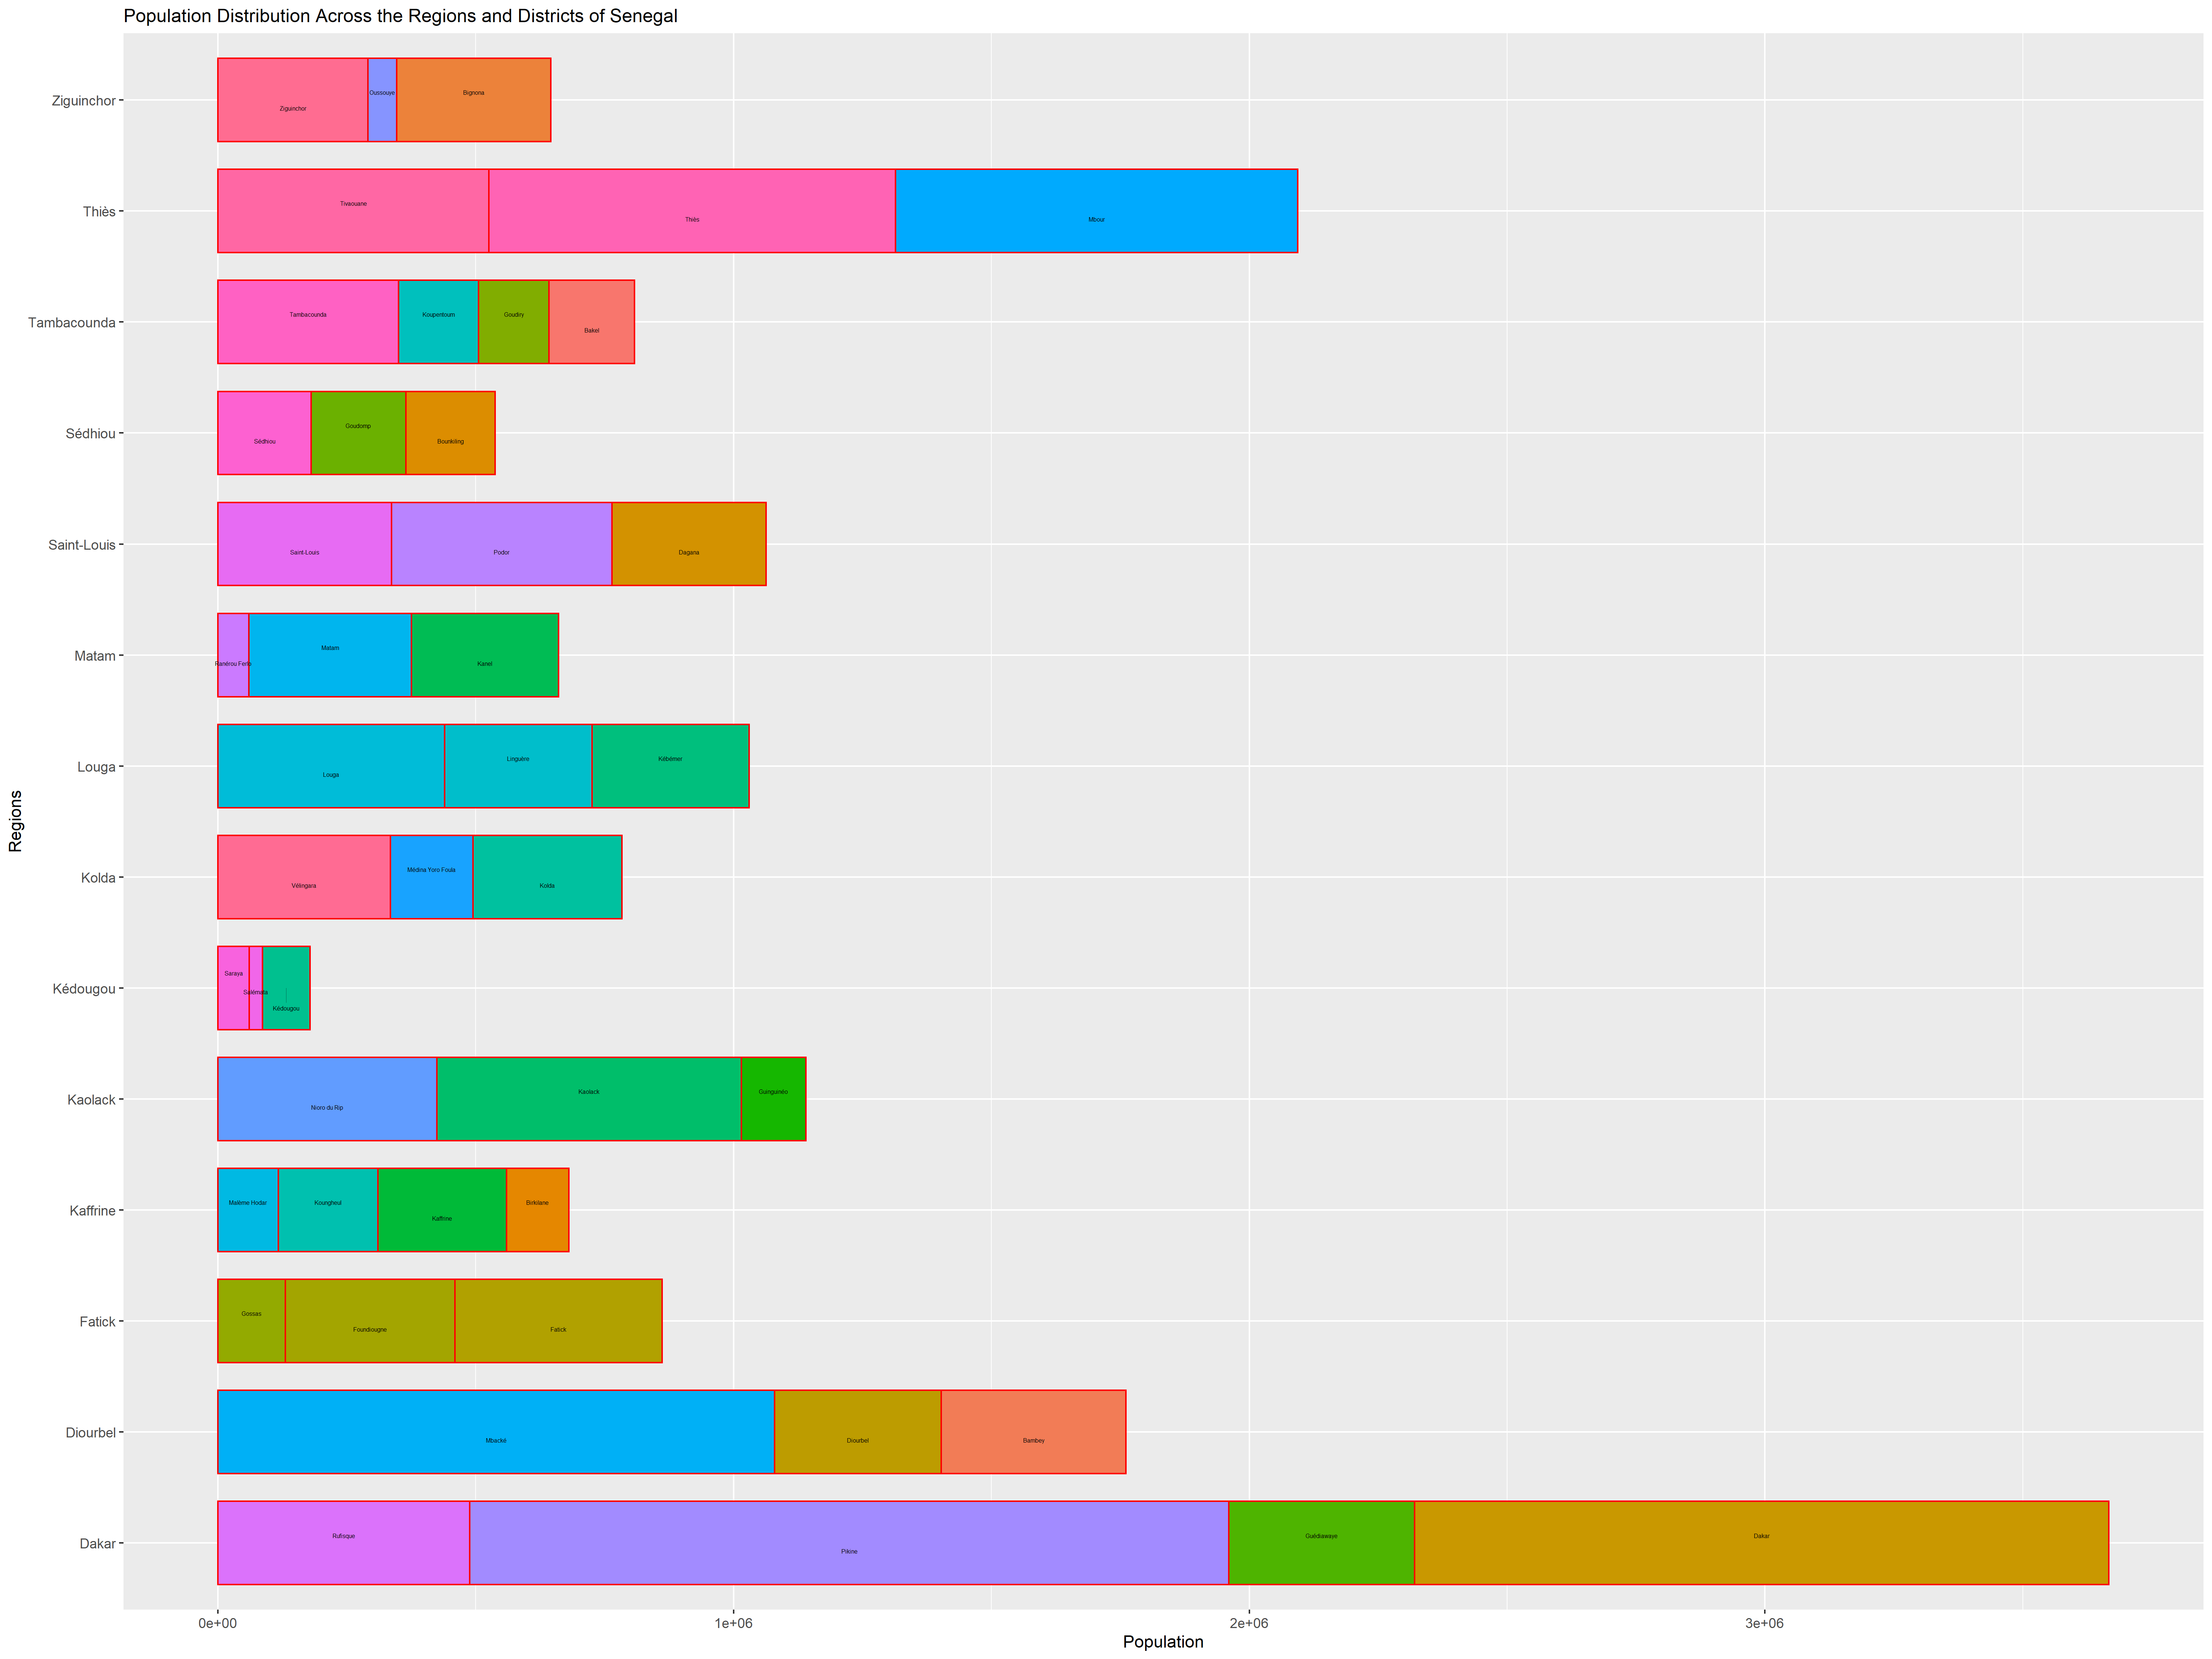
This bar plot provides further information about the distribution of Sengal’s population by also including subgroups of the district’s in each region. This plot further highlights the contrast between the population of Gabon’s western and eastern regions.
Stretch goal 2: A 3-dimensional Model of the Population Density of Senegal and its Regions
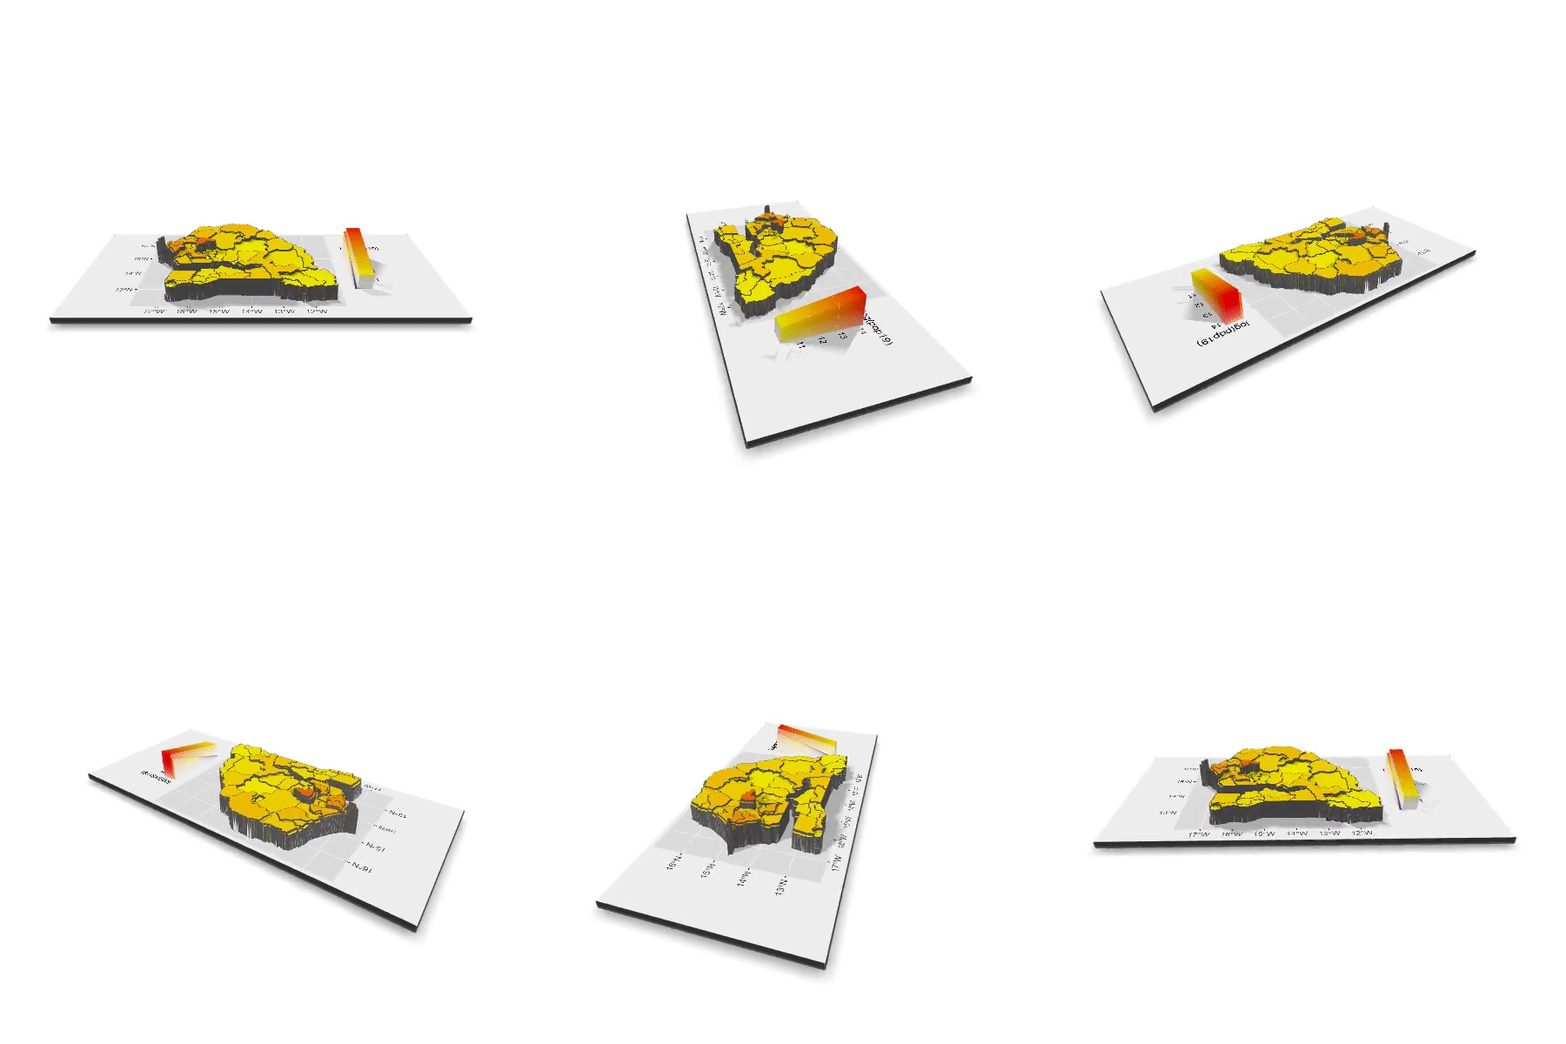
The 3D plot below also visualizes Senegal’s population density. In addition to having a higher instensity on the heat map, regions are taller if they have a higher population.
Defacto Descriptions of Human Settlements
In this part of the project I modeled the “defacto” descriptions of human settlements in Sengal’s kedougou region by showing the areas in which people congregate. I chose to focus my analysis to the kedougou region because it is Senegal’s least populated and most rural region (my research indicated that it is teaming with wildlife). This provided two benefits: it is computationally easier to examine a region with a small population and, more importanly, I wanted to examine a lesser populated rural area because those areas usually get overlooked by nationally representitive surveys.
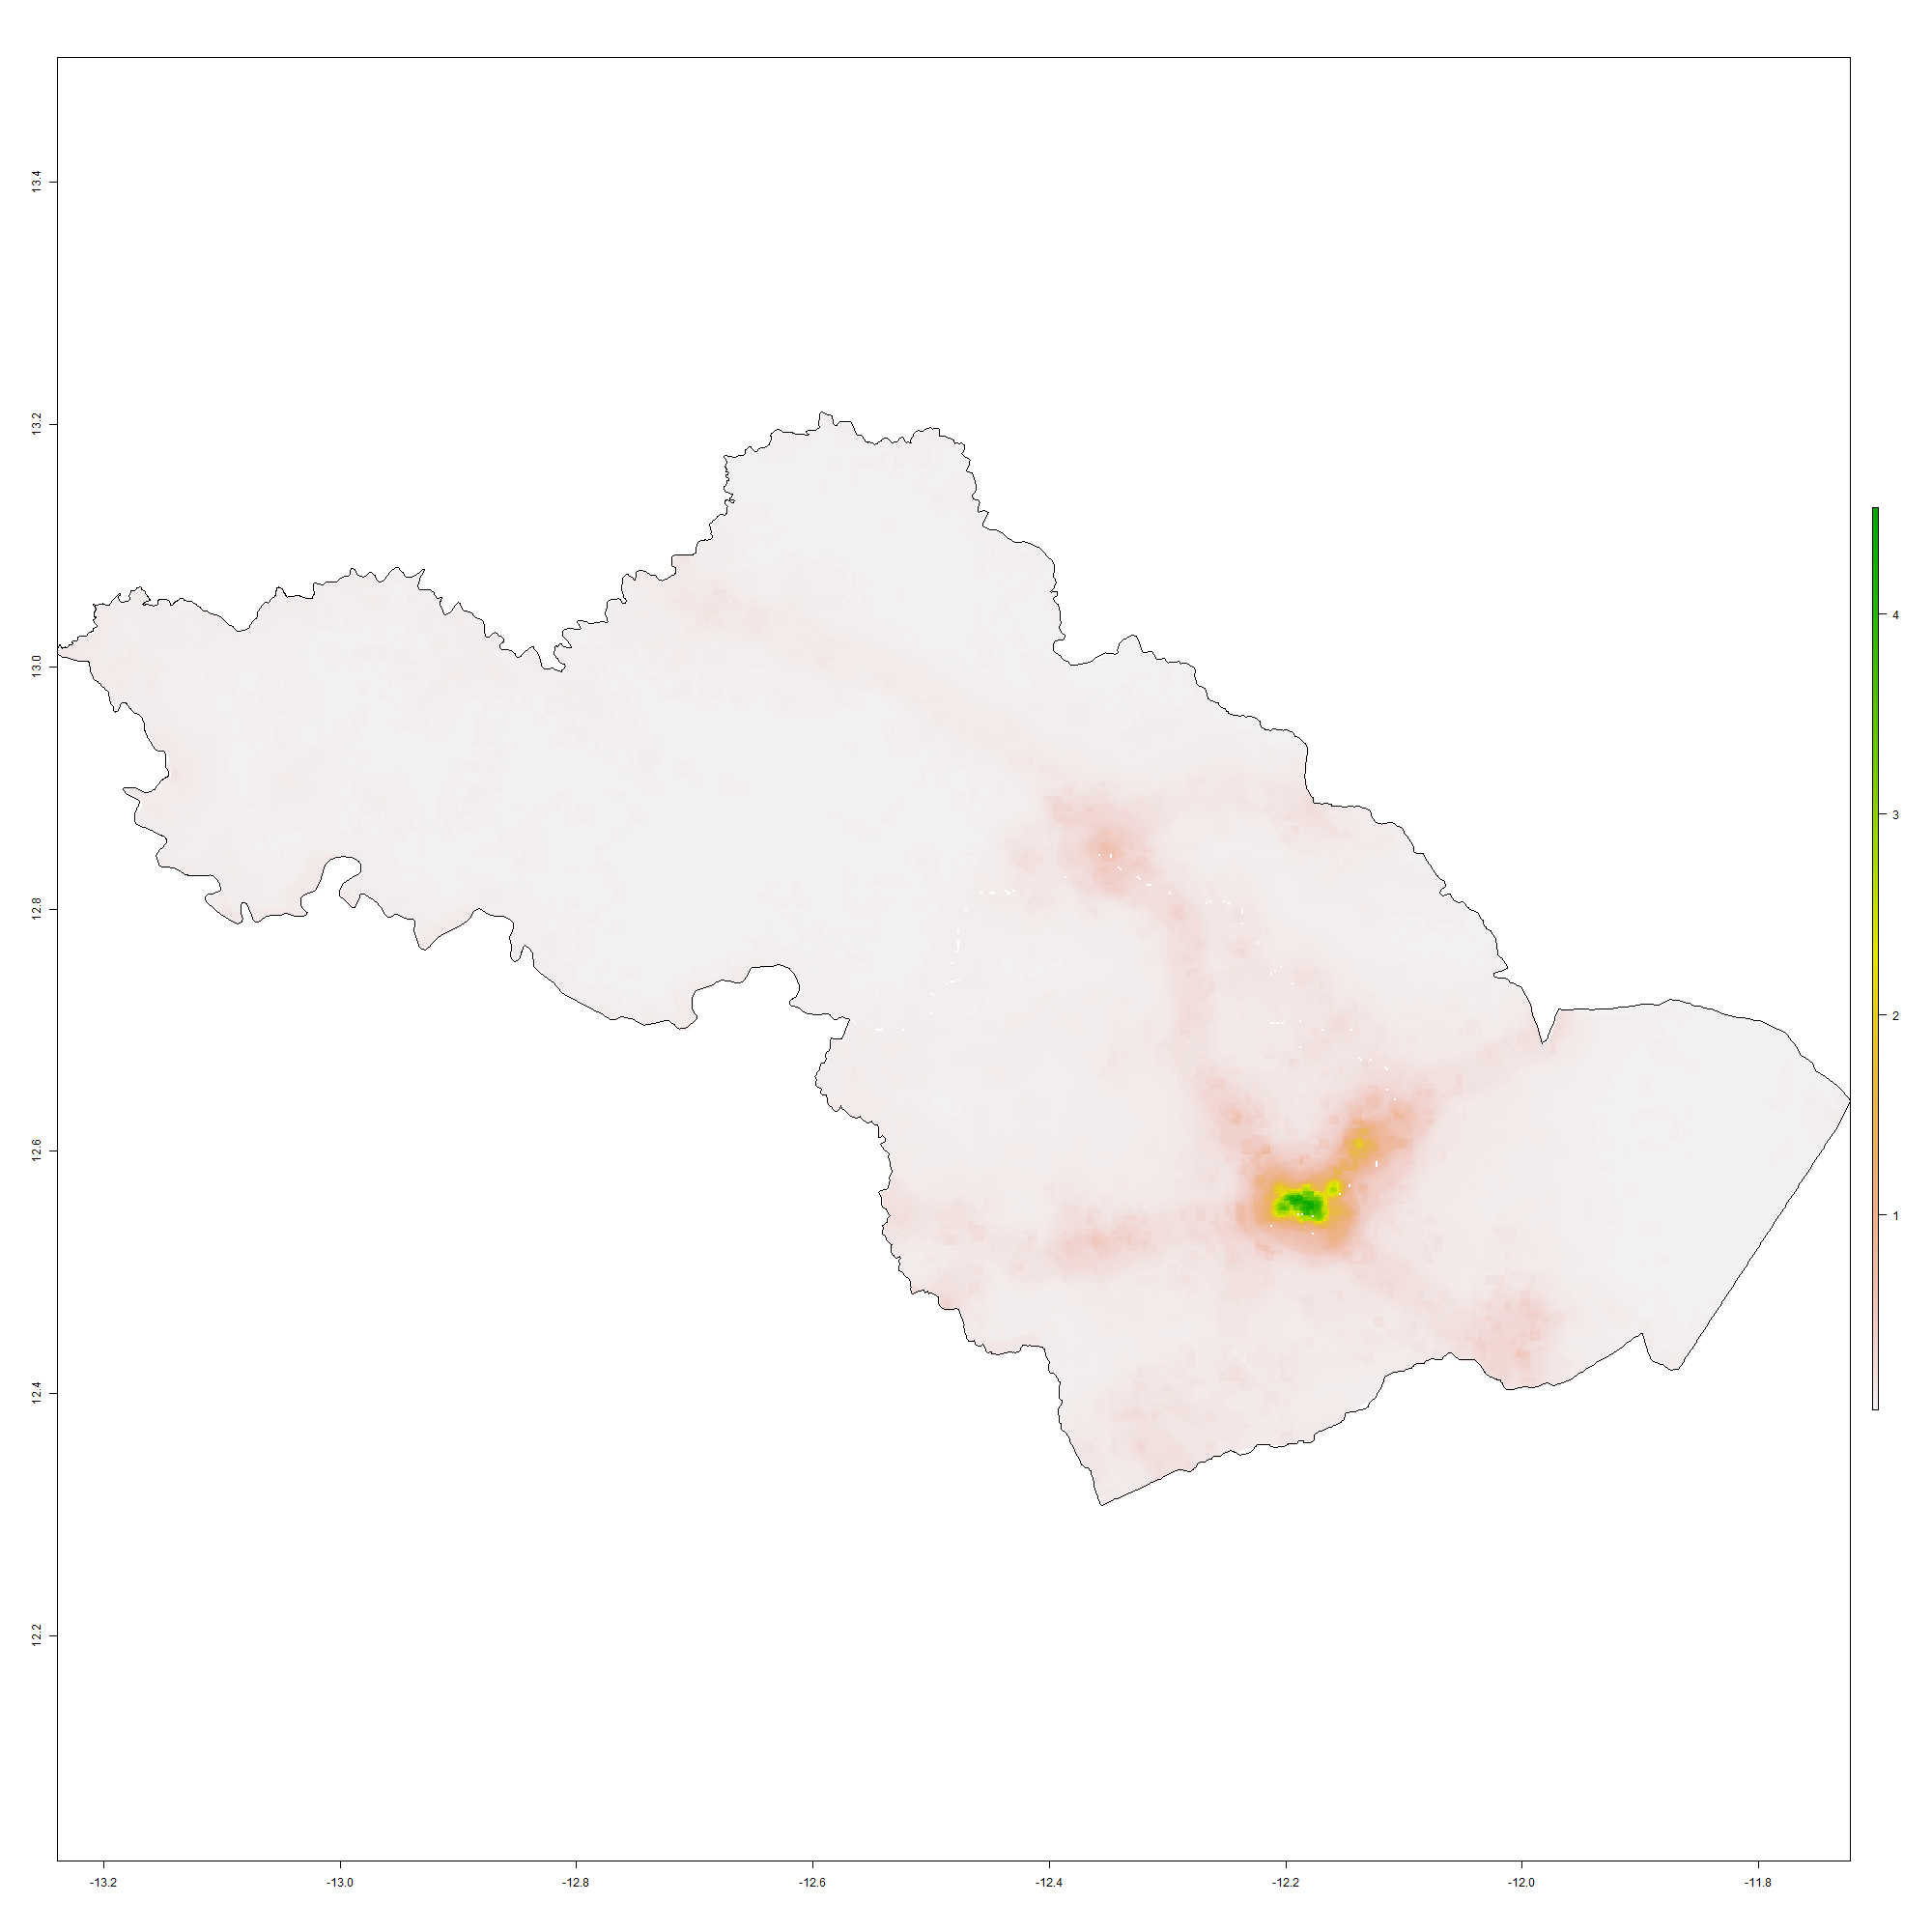
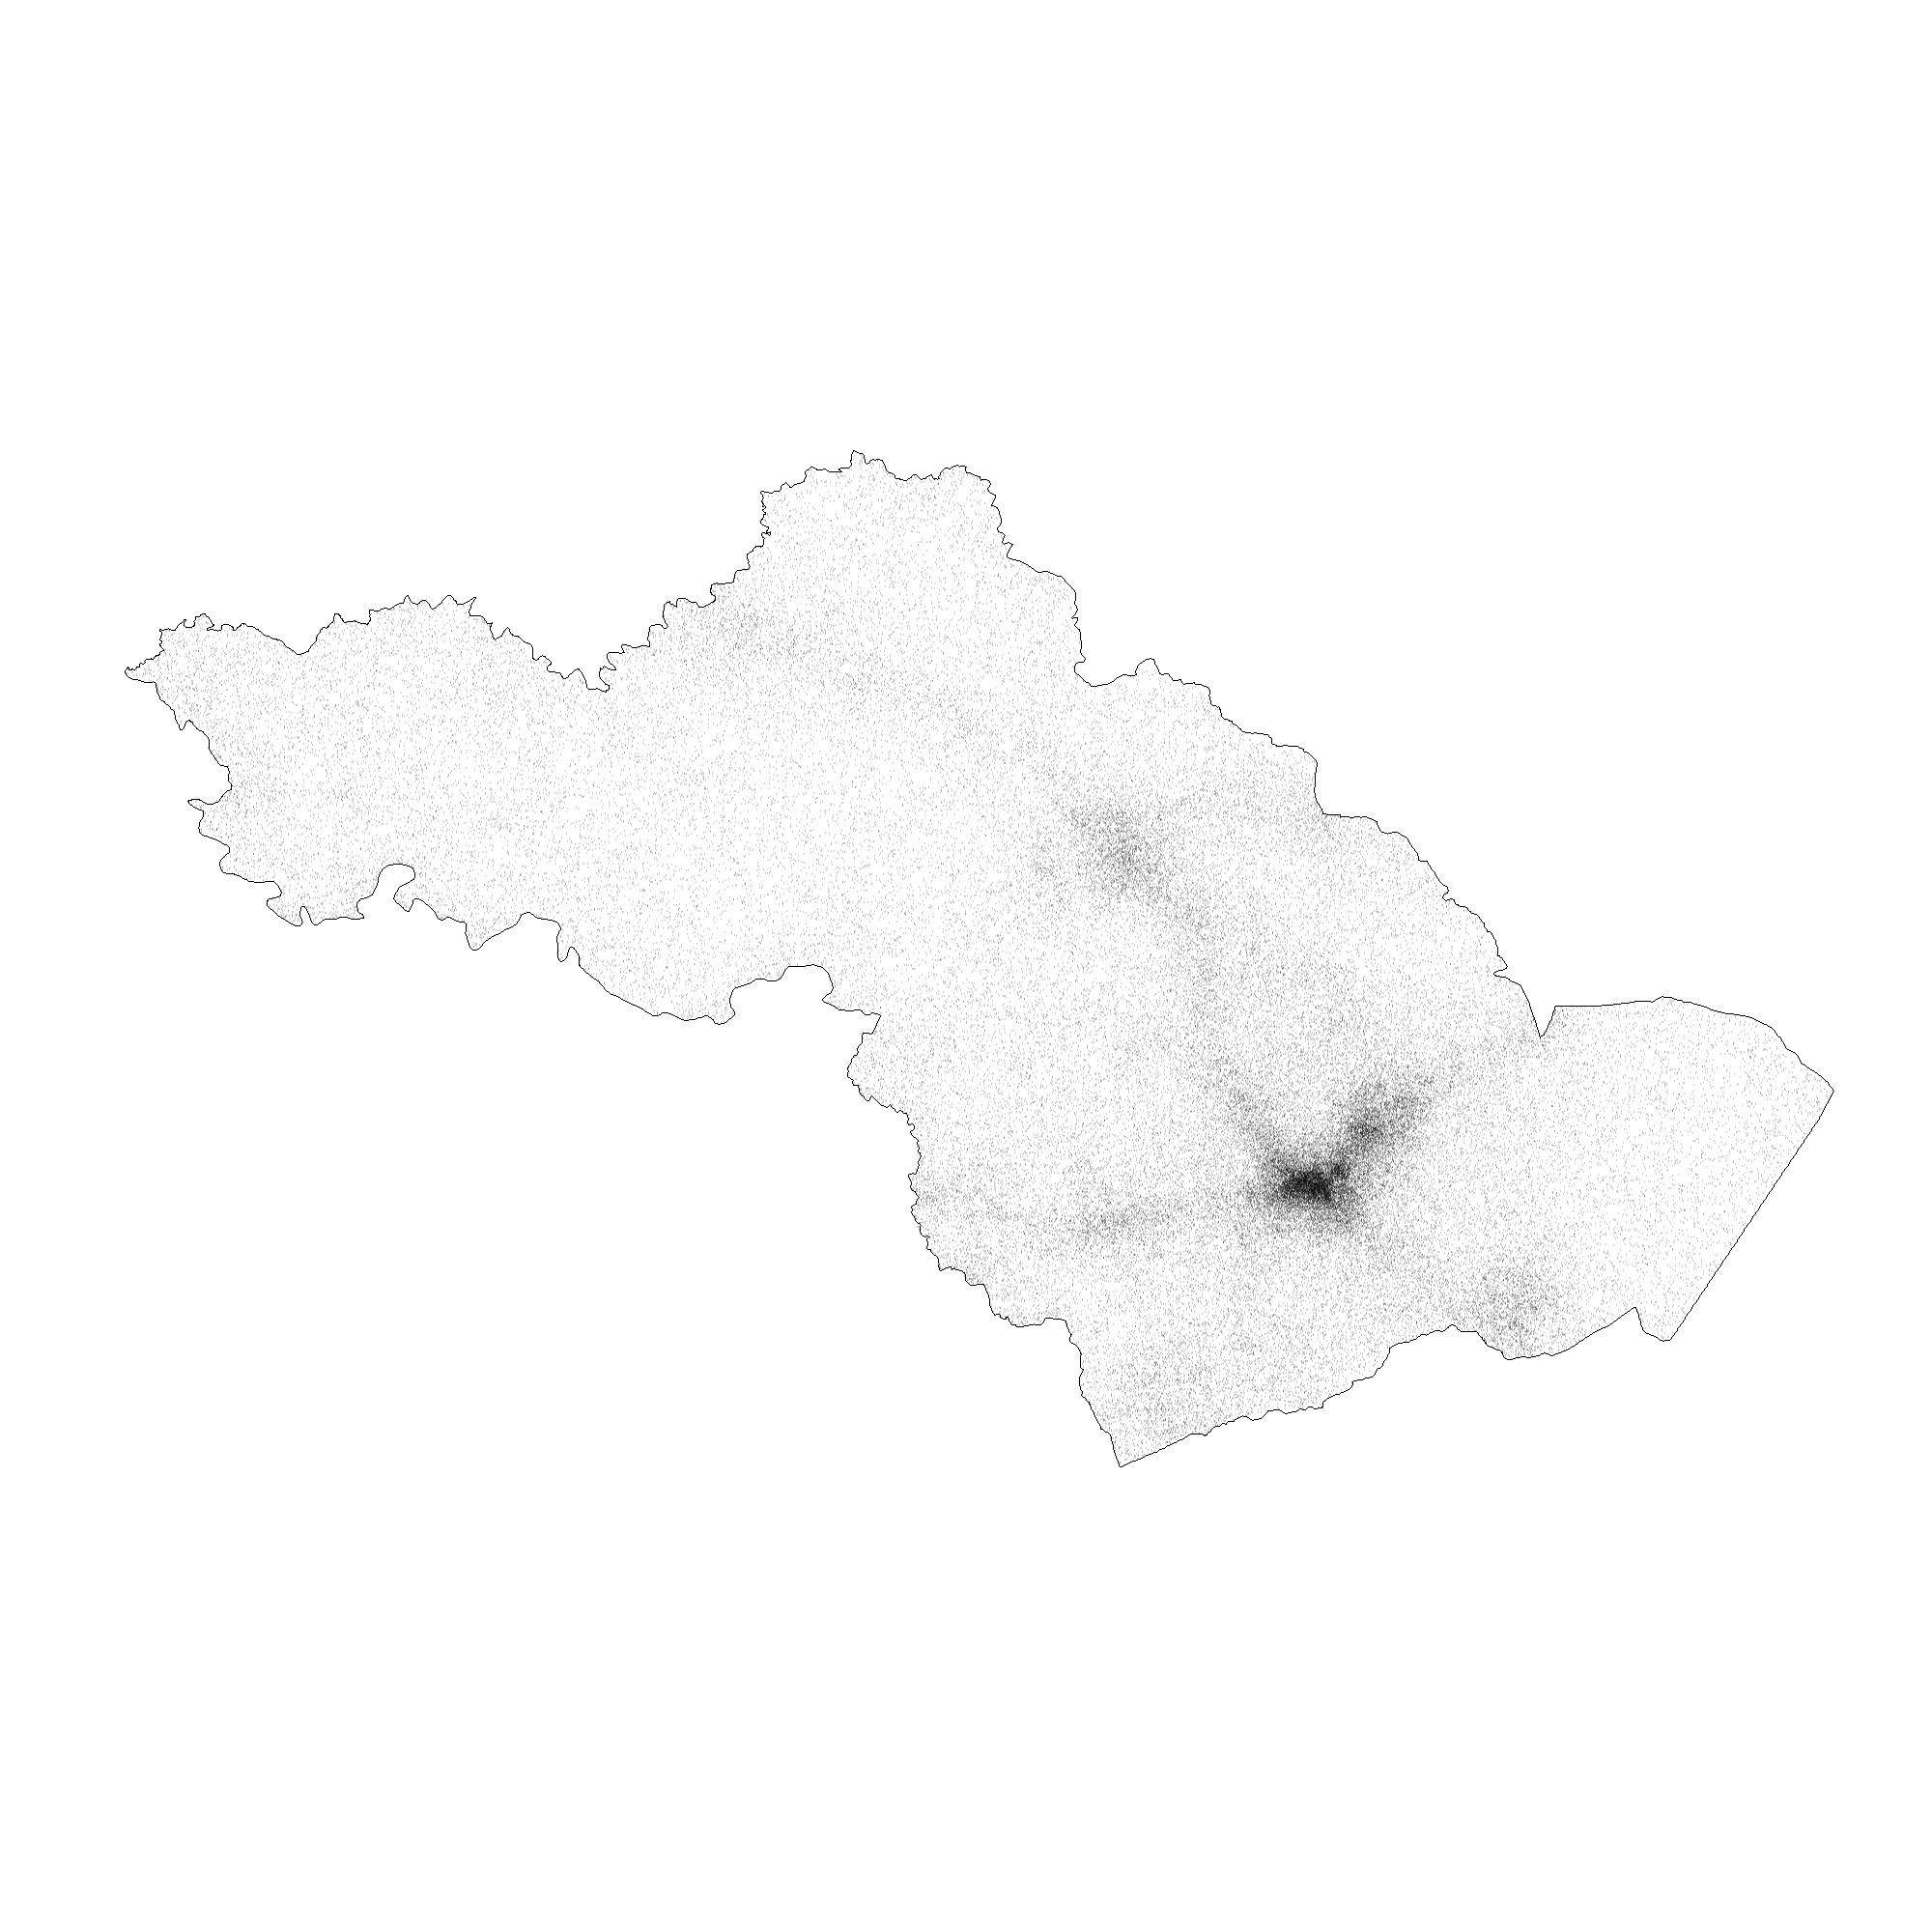
I began by first modeling the kedougou district within the kedougou region. These plots show the population density of kedougou. The first plot is a population raster on top of a map shapefile and the second uses its shapefile to calculate the population density with rpoint and plots this on top of the first plot.
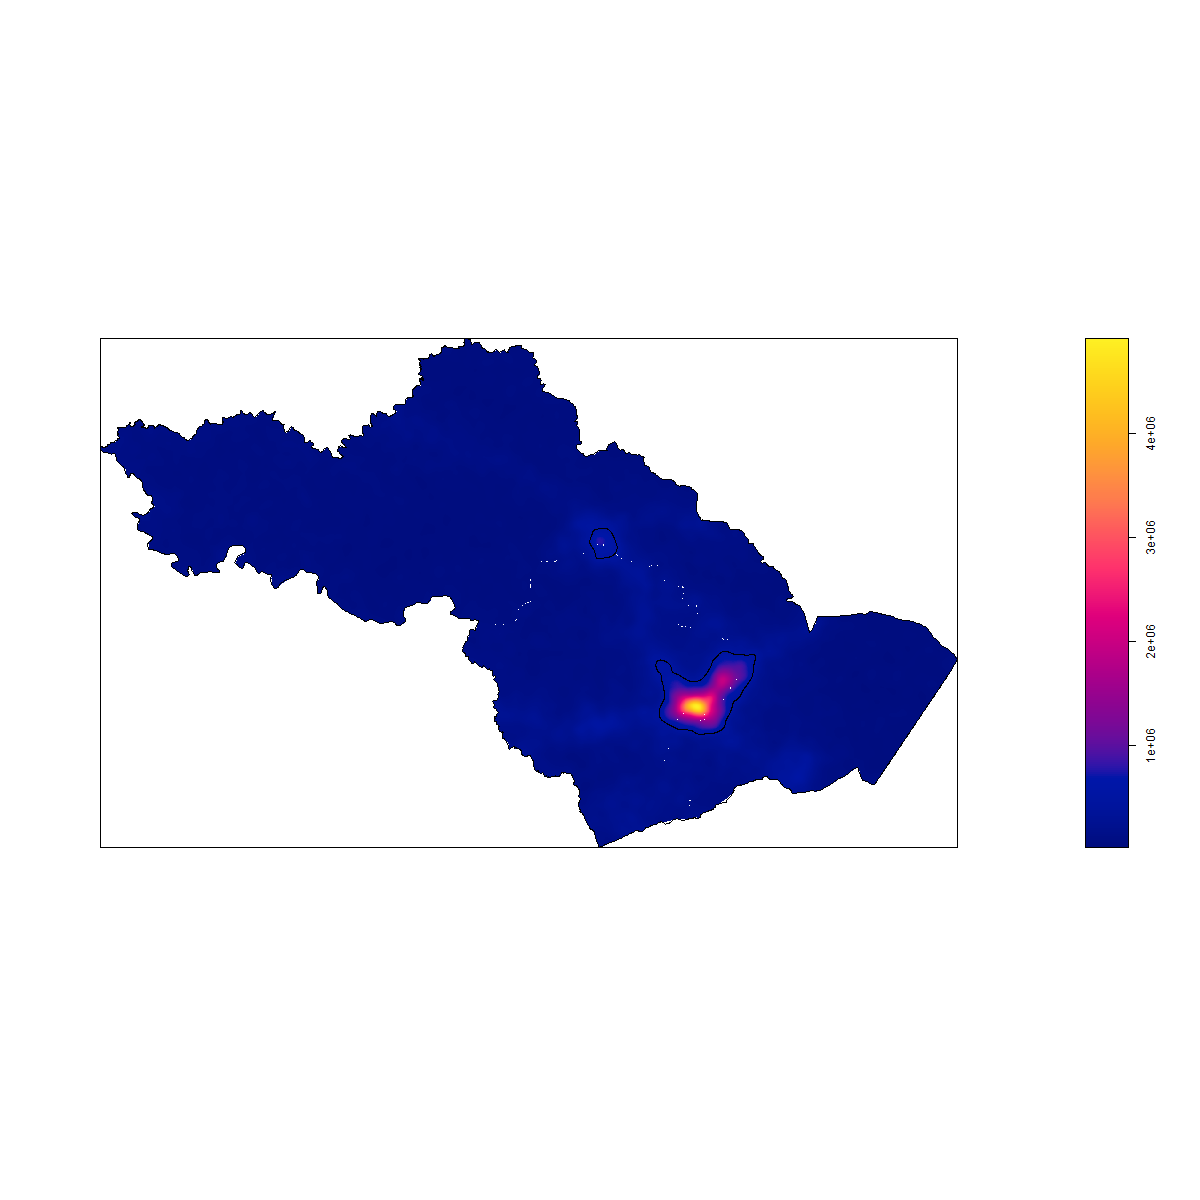
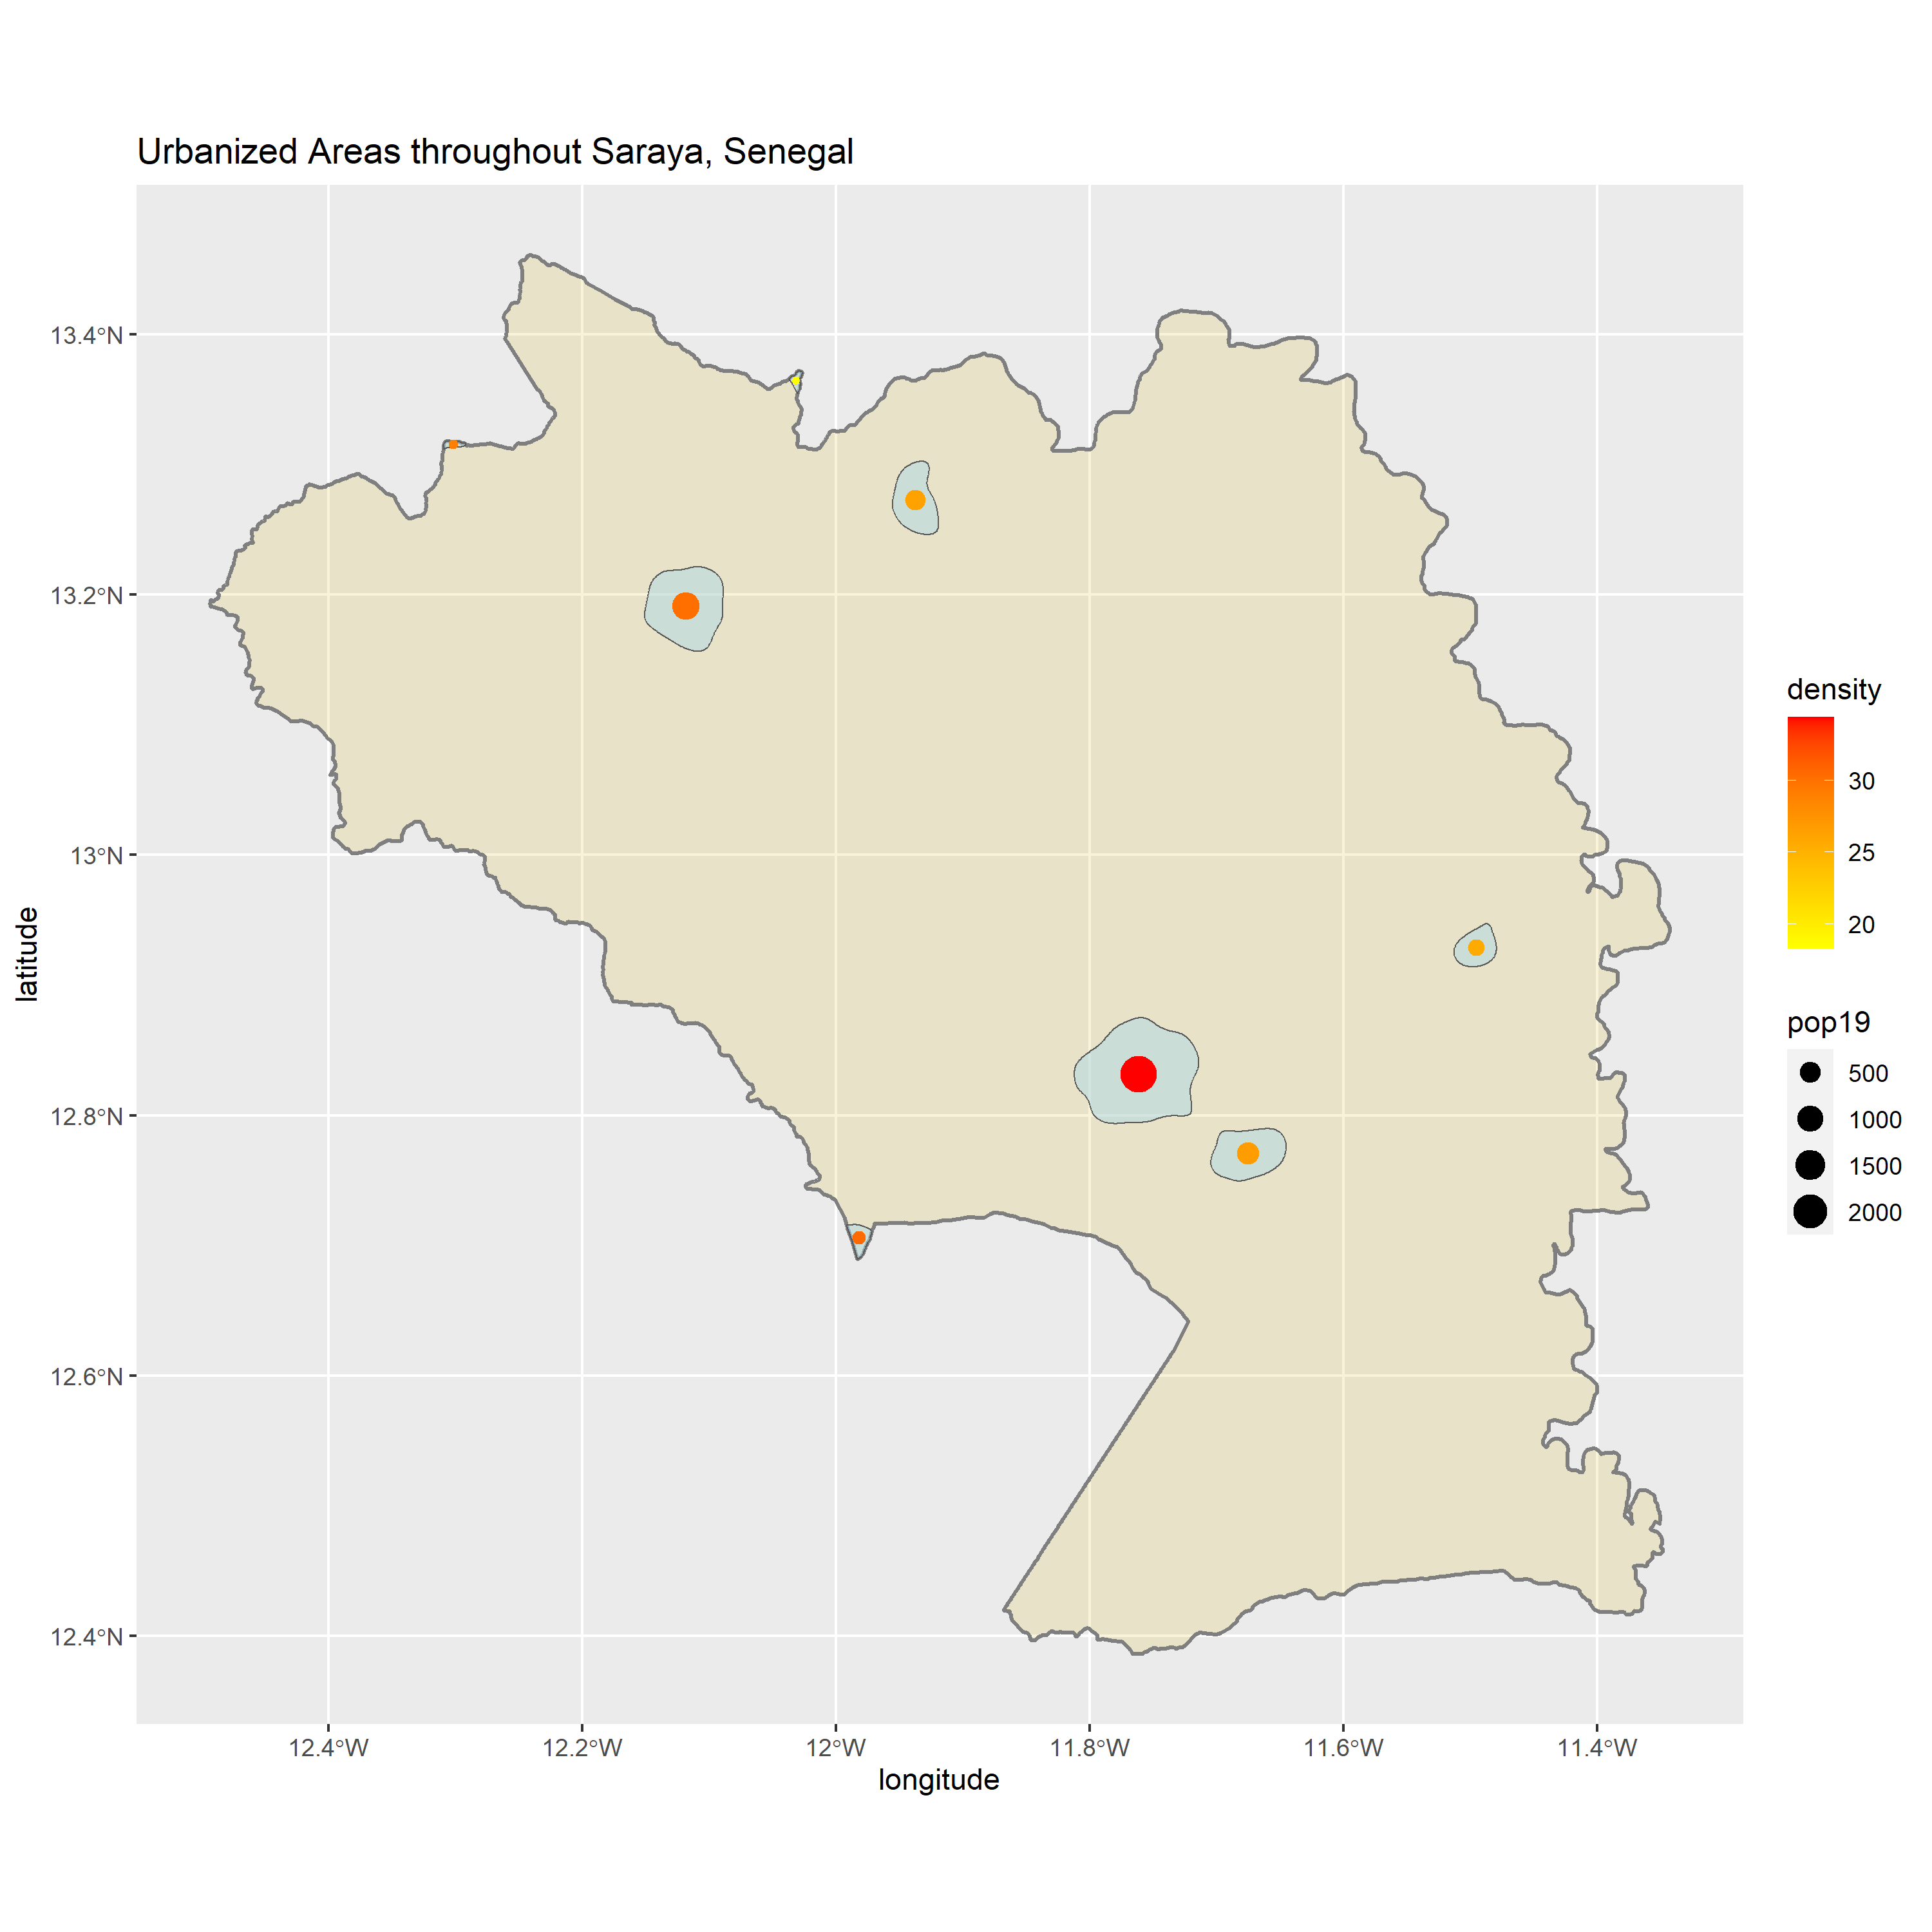
I then ploted the countour lines, which represent the De Facto human settlements, over the density image. I filtered the map to remove polygons that might be outliers (too large or too small densities and populations), such as those with absurdy high or low densities and populations. I used this information to map the Urbanized areas in kedougou with its population densities.
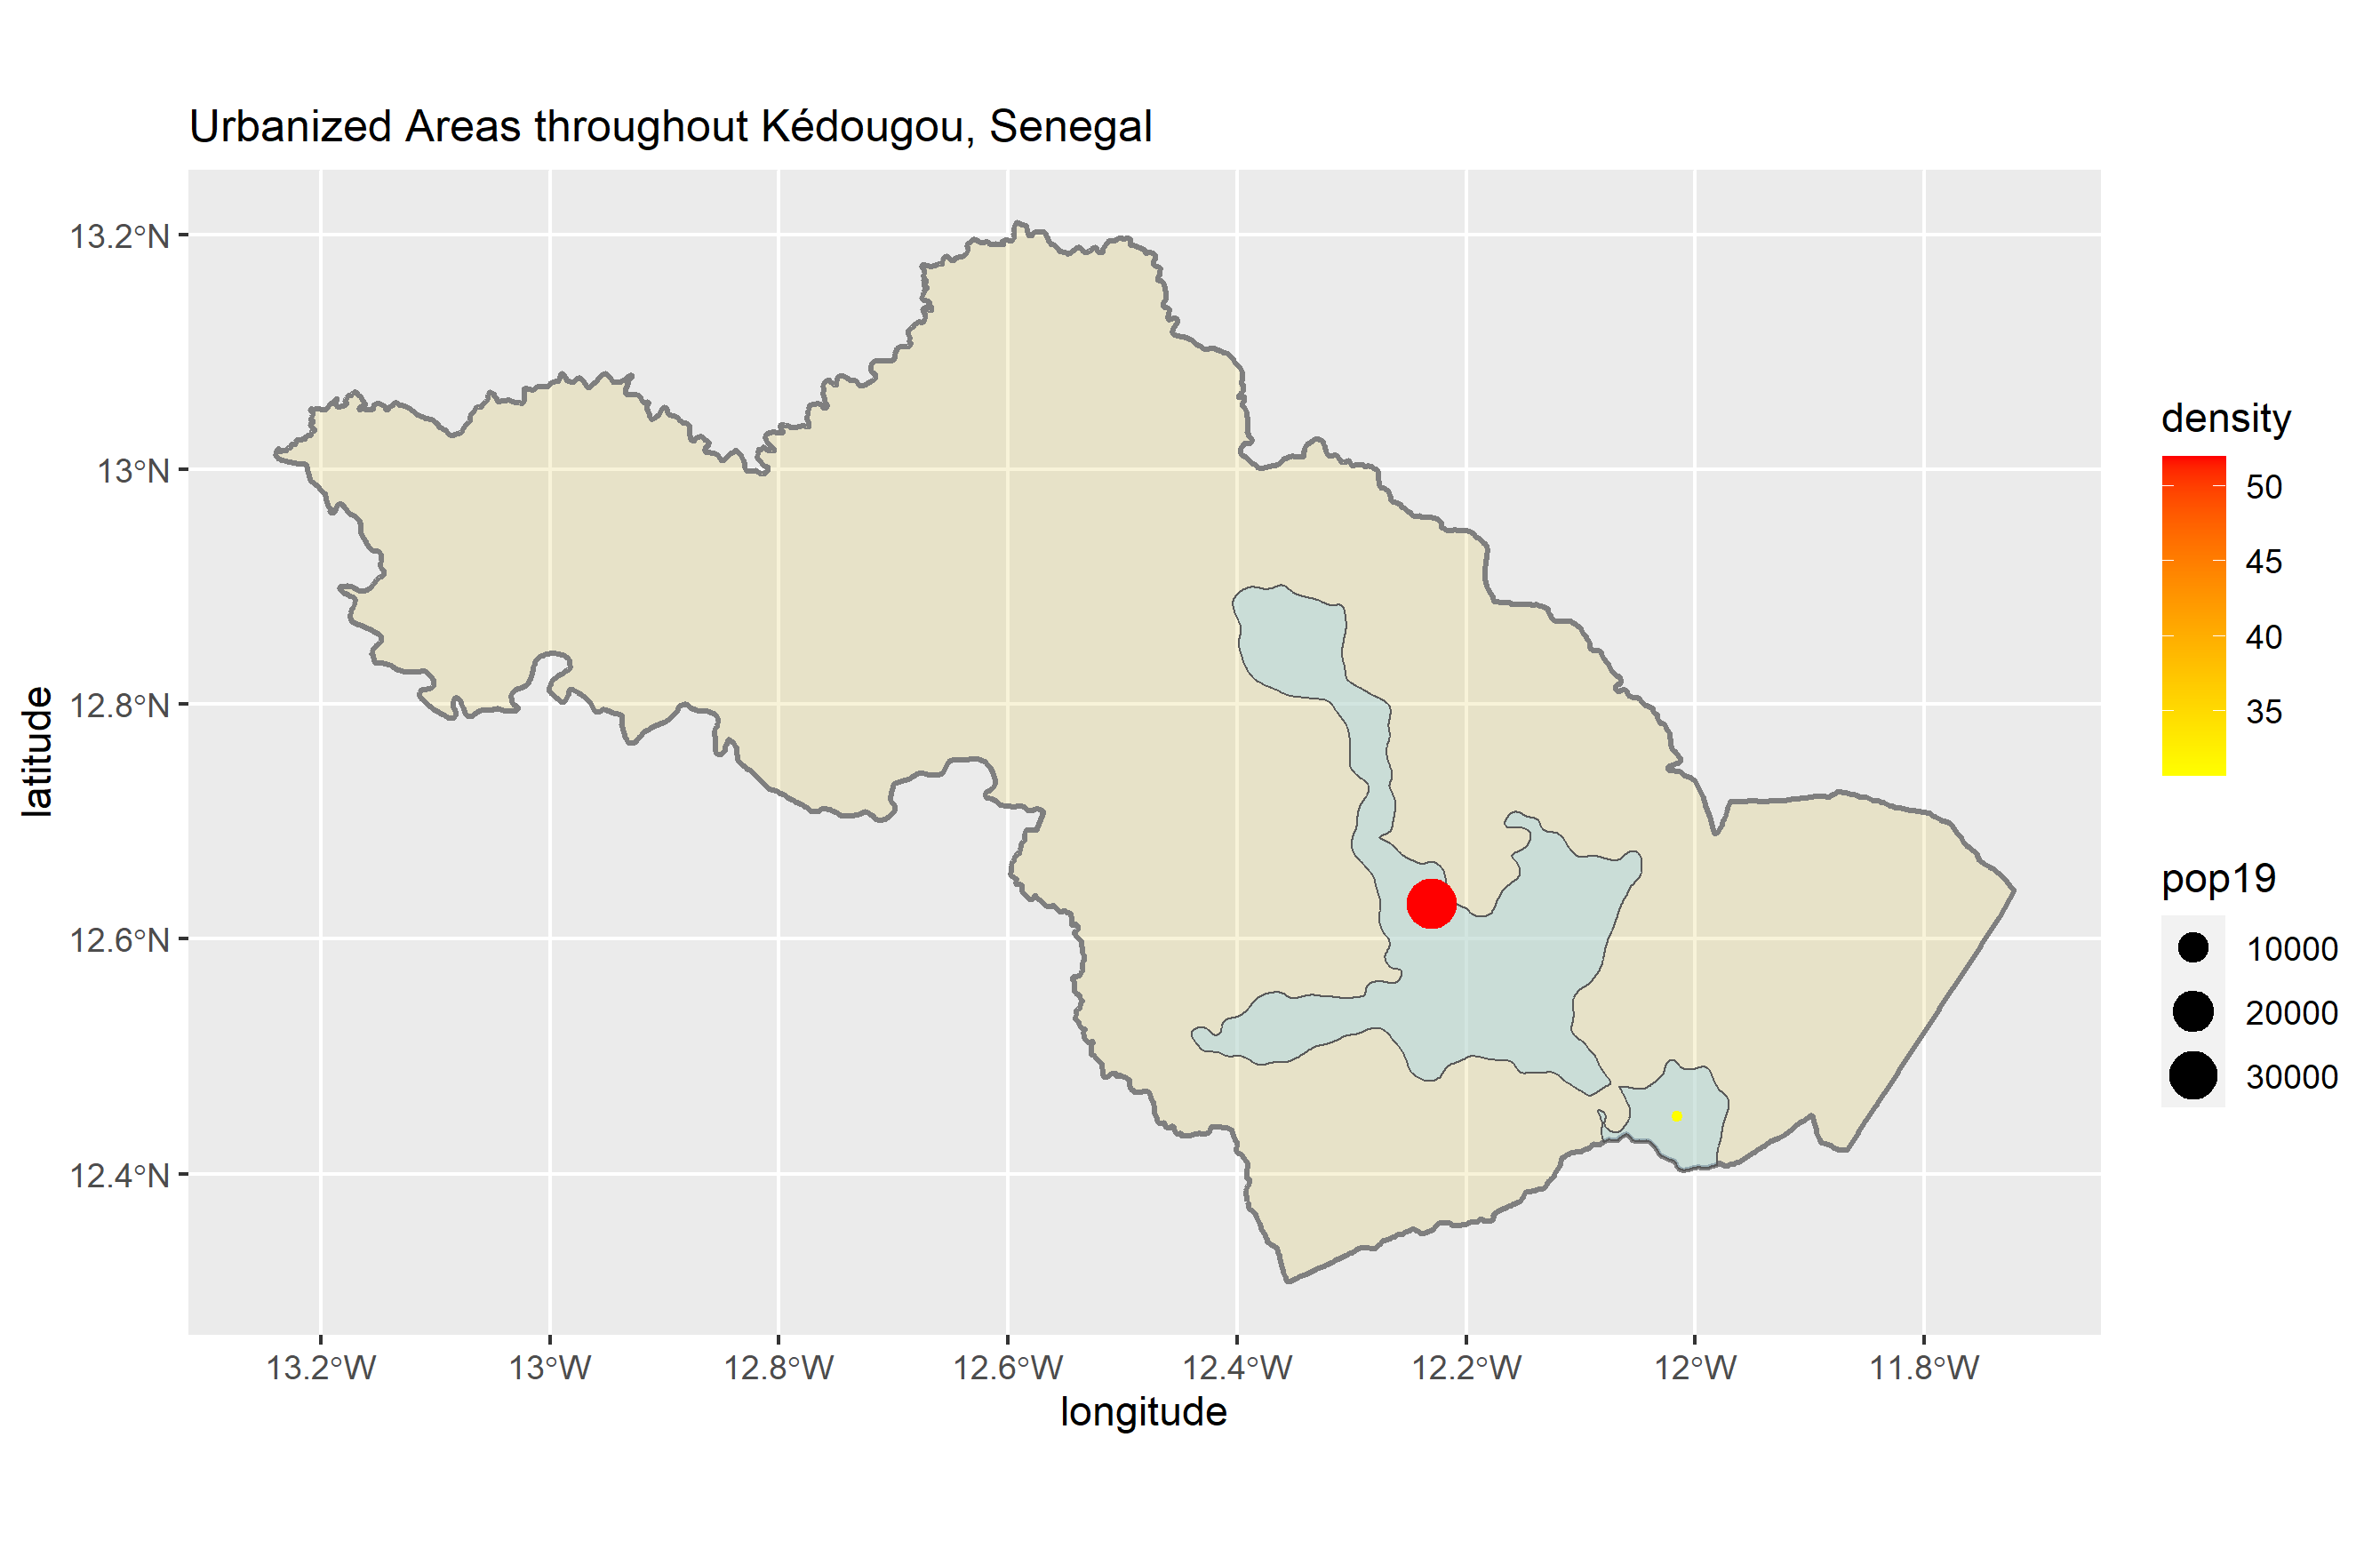
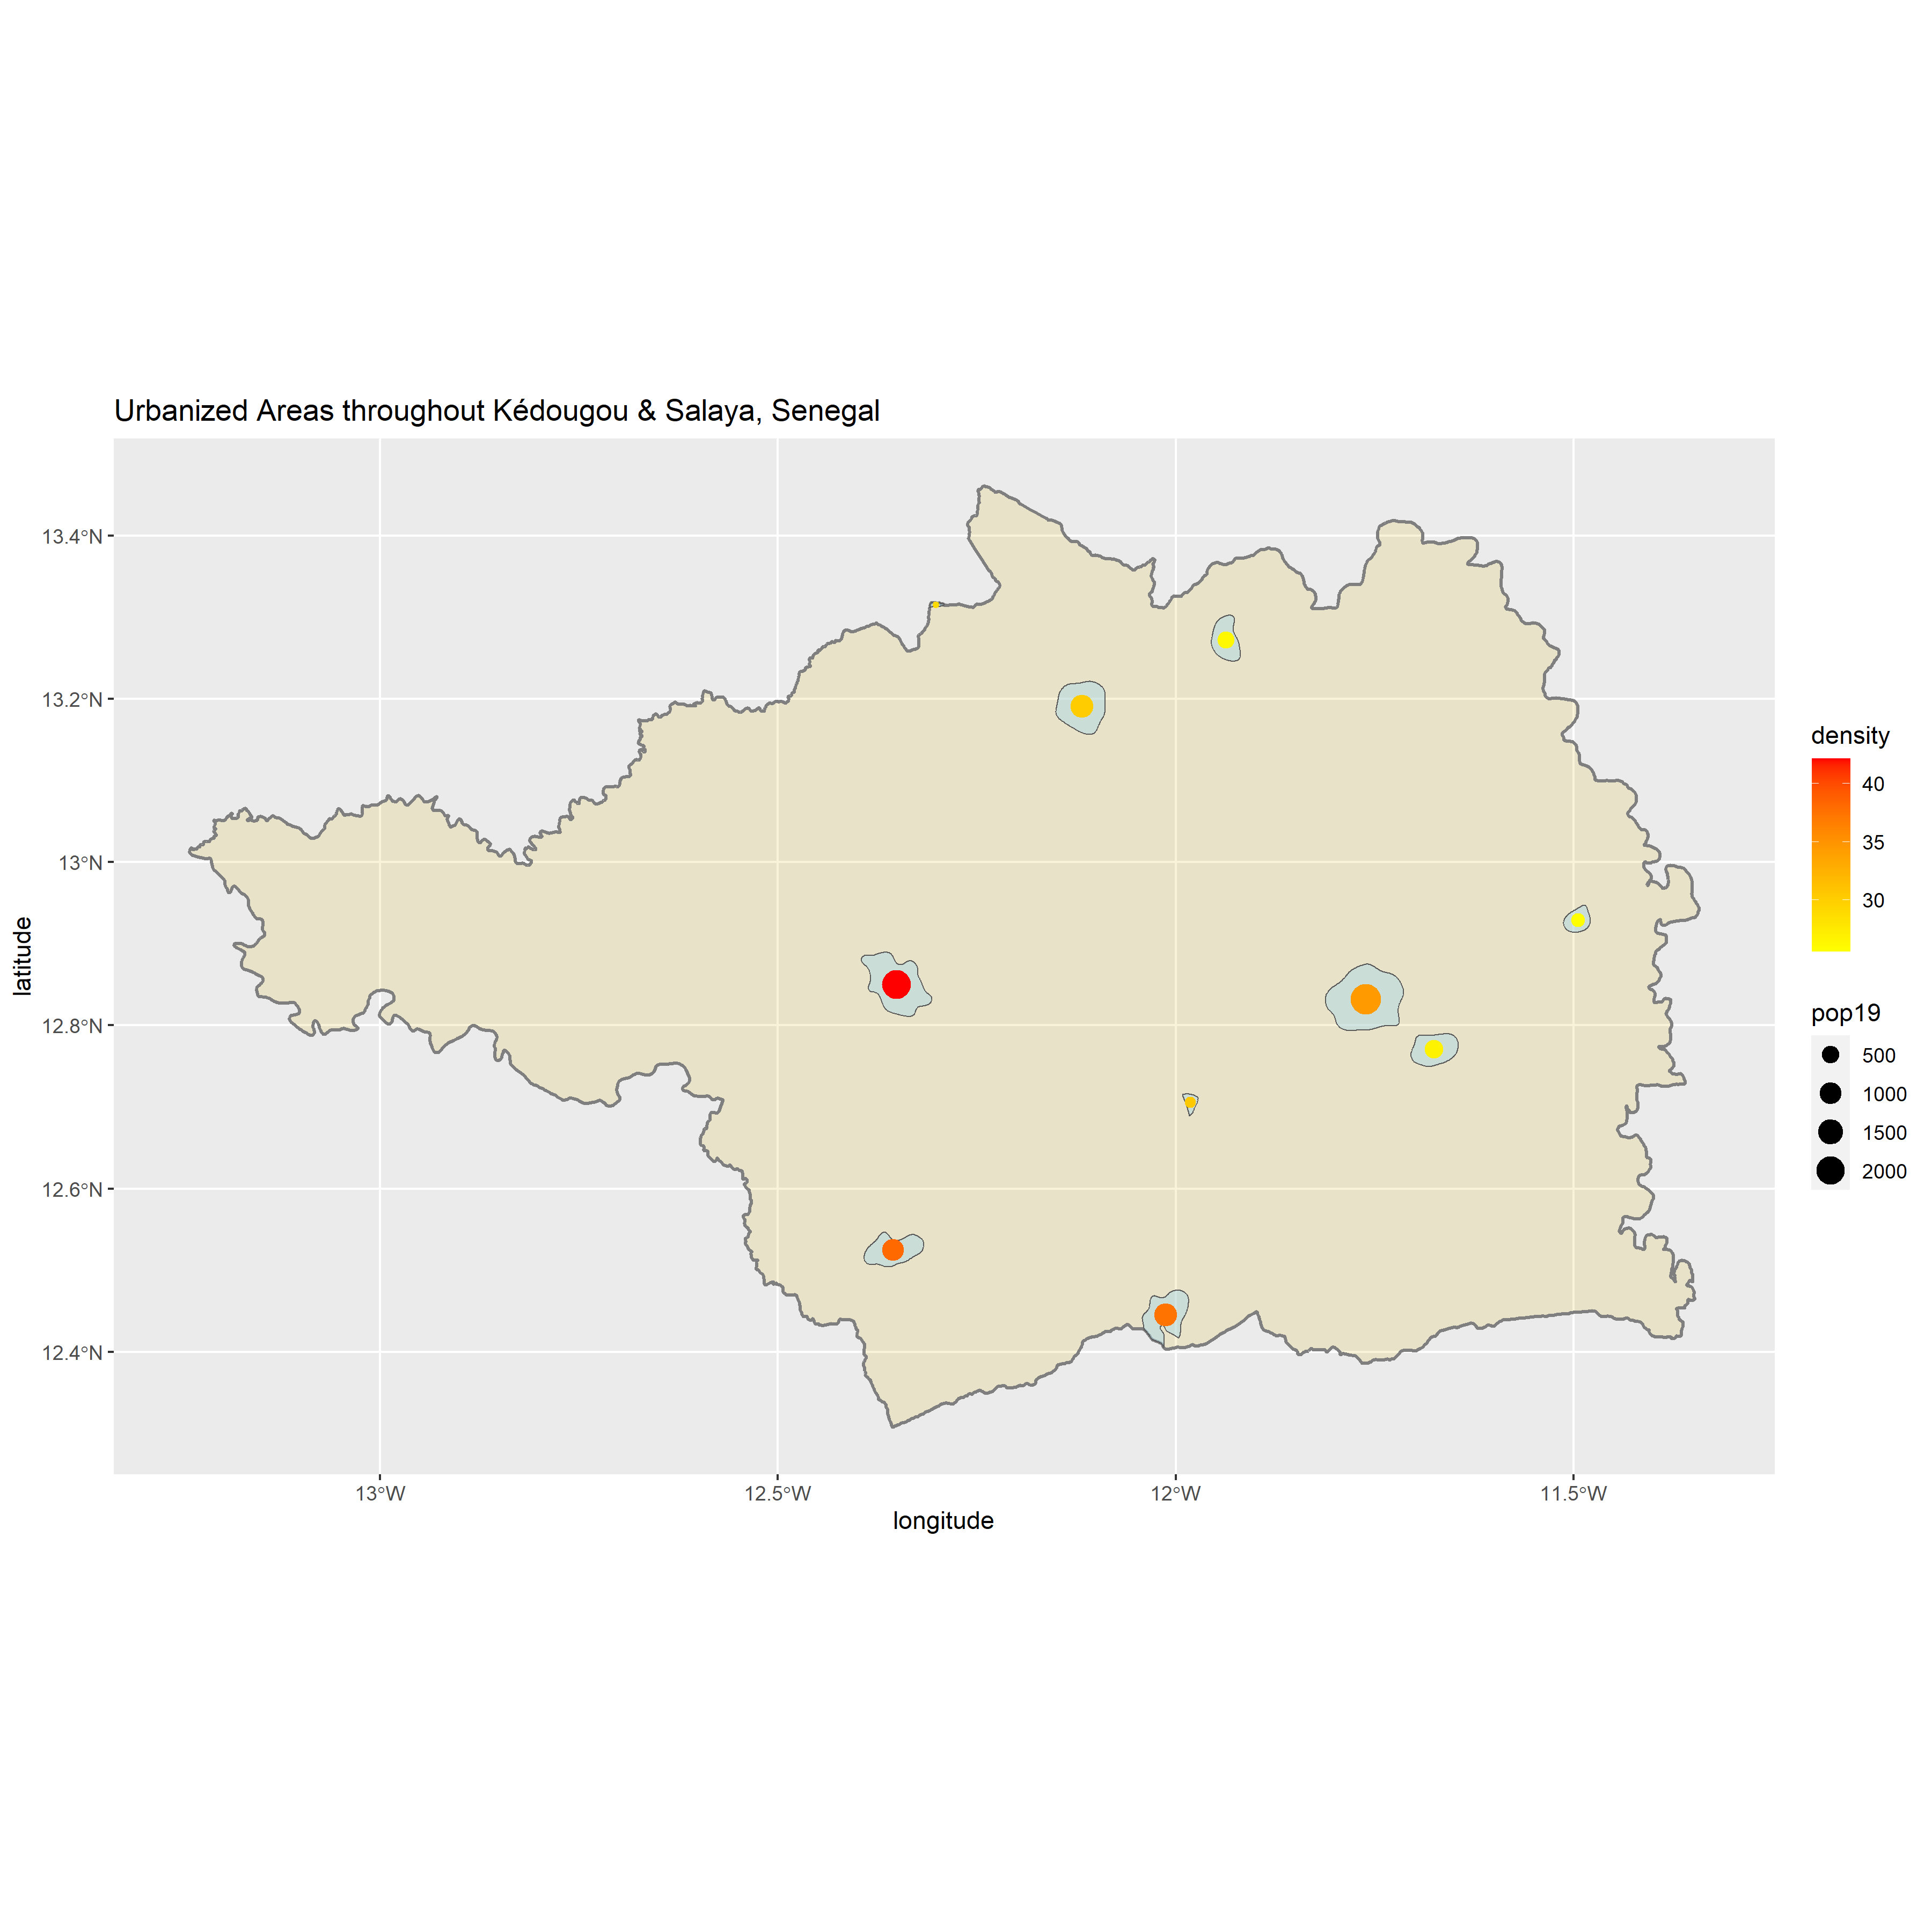
I expanded my analysis of De Facto Urban settlements in the kedougou region by adding the district of Salaya. I repeated the steps from the kedougou plots above with Salaya and then created a model of Urbanized areas in the kedougou and Salaya districts.
As can be seen below, the settlements in kedougou and Salaya are small and sparsely located. This makes sense considering that the kedougou region is moslty plains that are teaming with wildlife. looking at my plots, I noticed that the settlements tended to be concentrated around rivers.
Stretch goal: Zipf’s Law
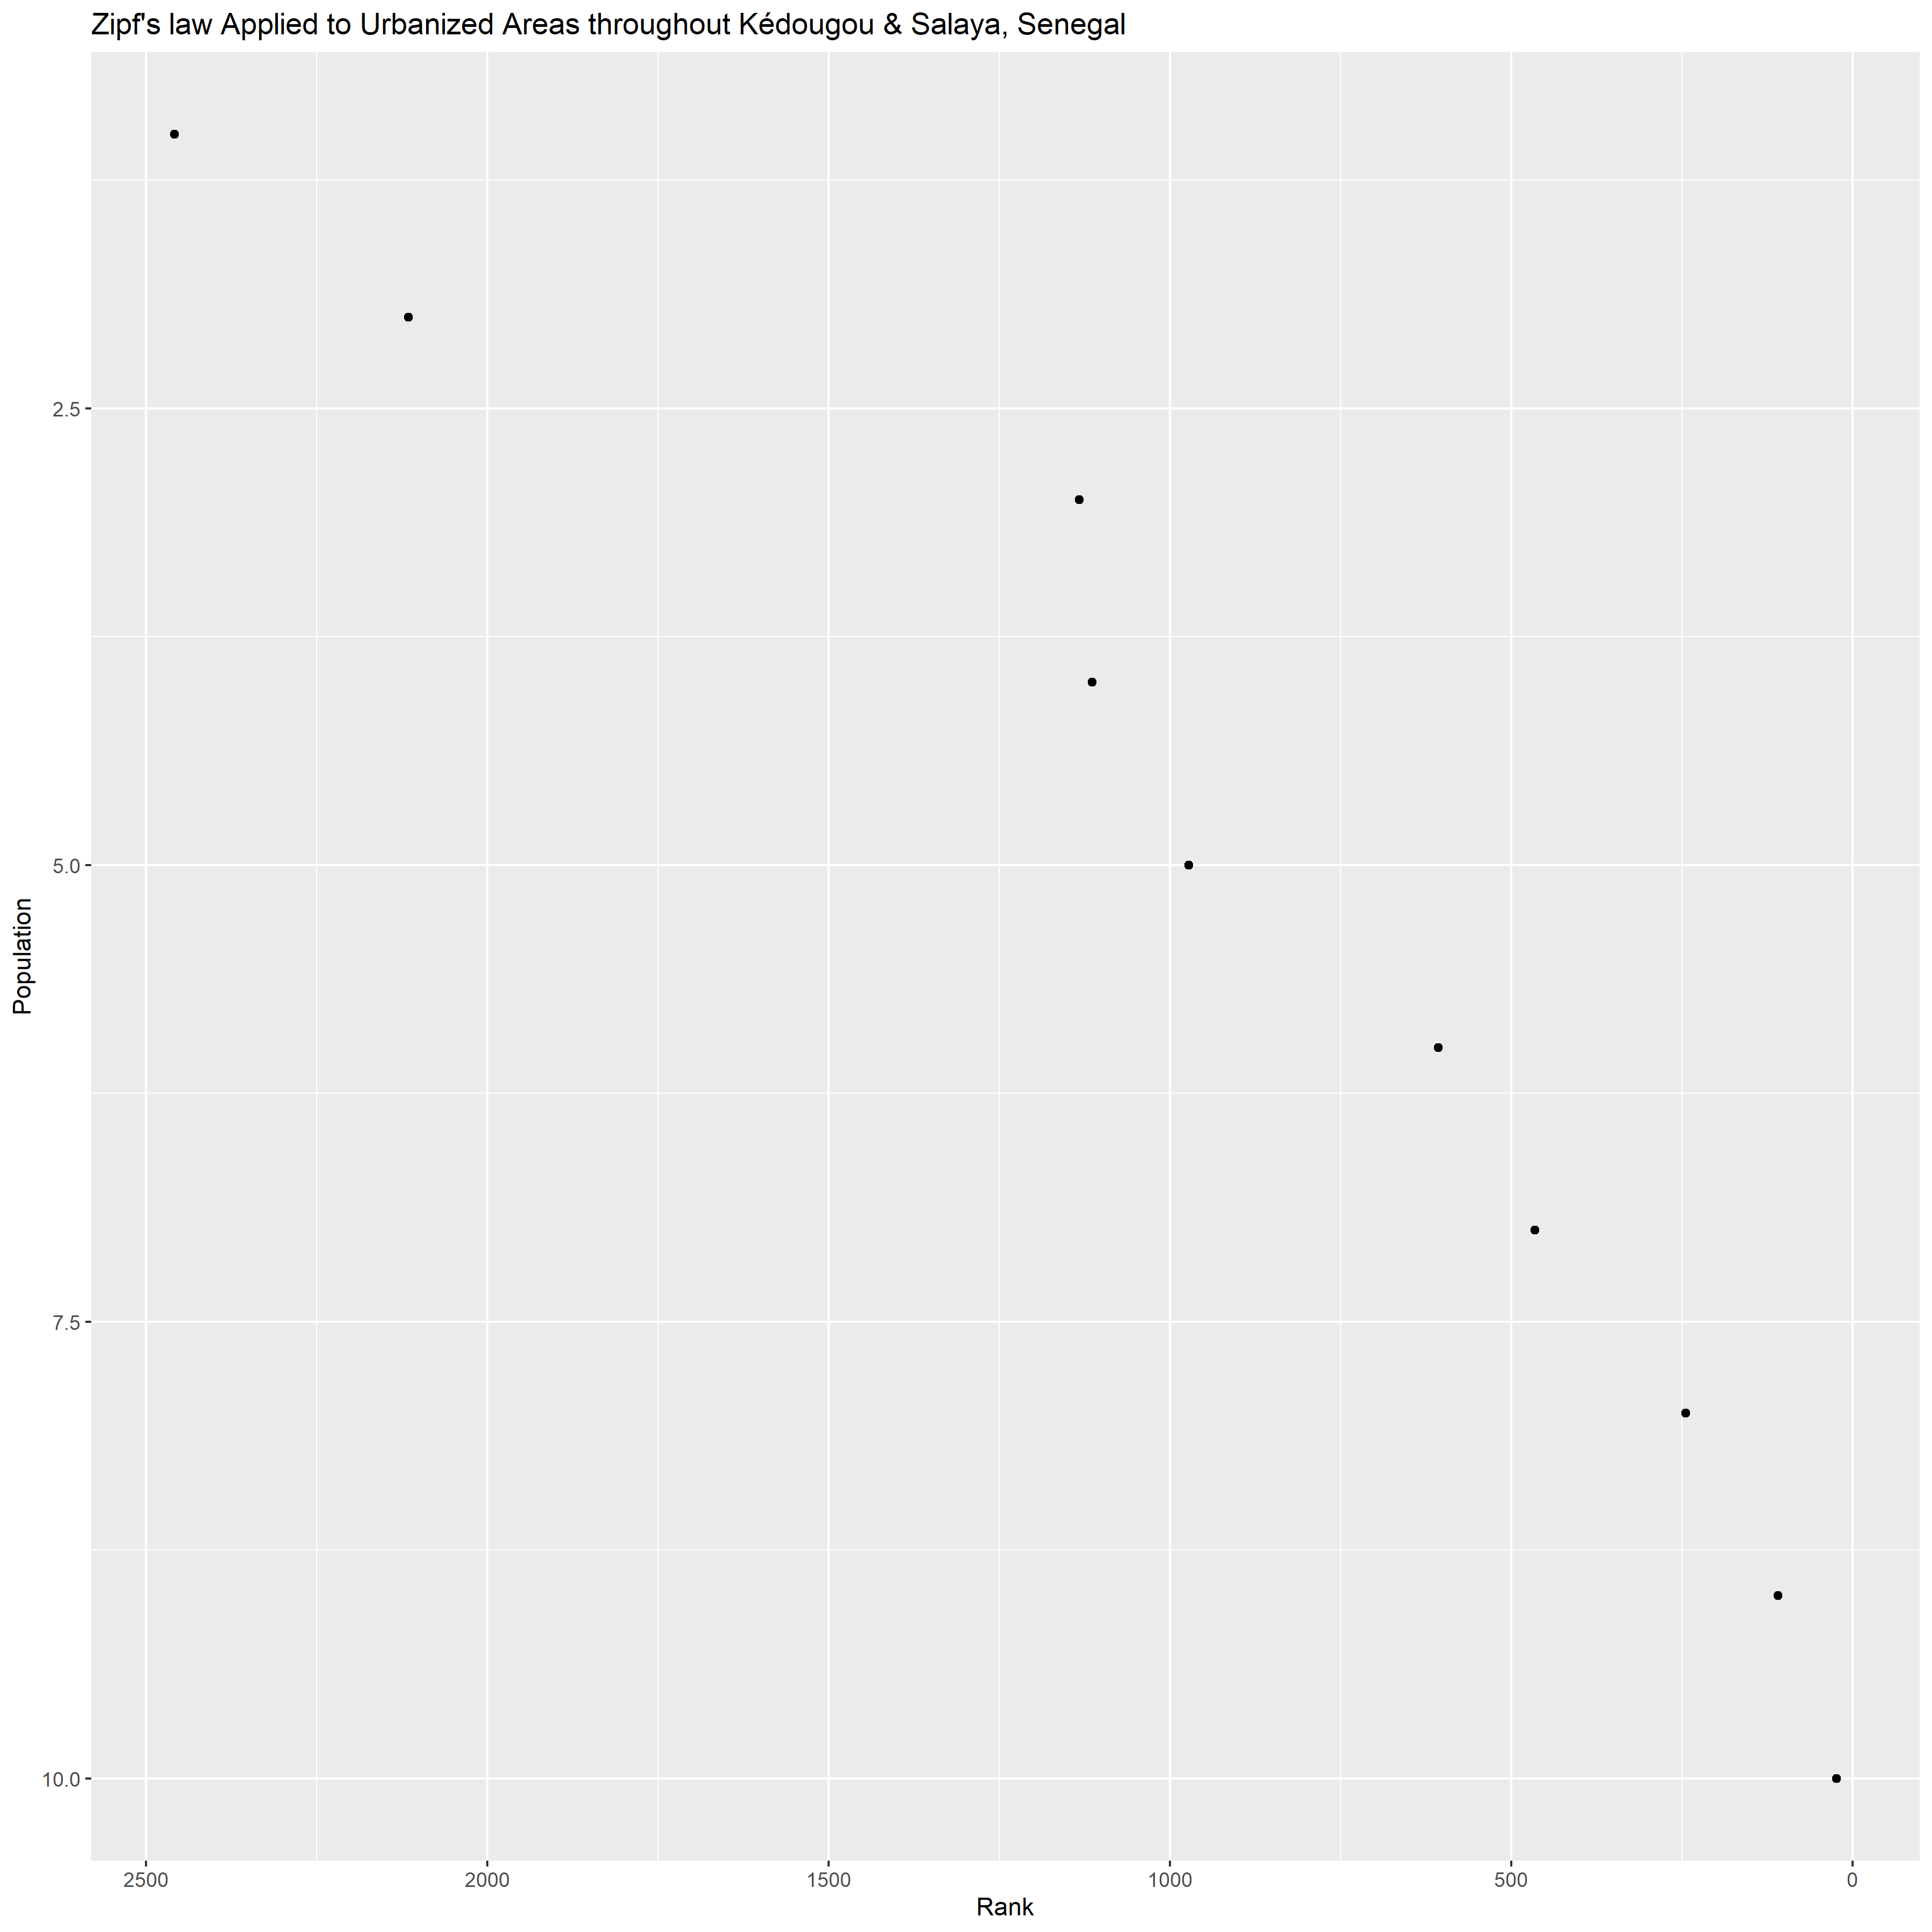
Here I plotted the logs of each of my Urban Areas’ population densities and rank to see if they follow Zipf’s Law. Although, there isn’t a line of best fit in this plot, it is still evident that the data does not completely in line with Zip’s law because the log of the densities are above what the expected densities would be. This indictes that the urban settlements are a bit more densly populated than expected.
Adding Transportation Networks and Healthcare Facilities:
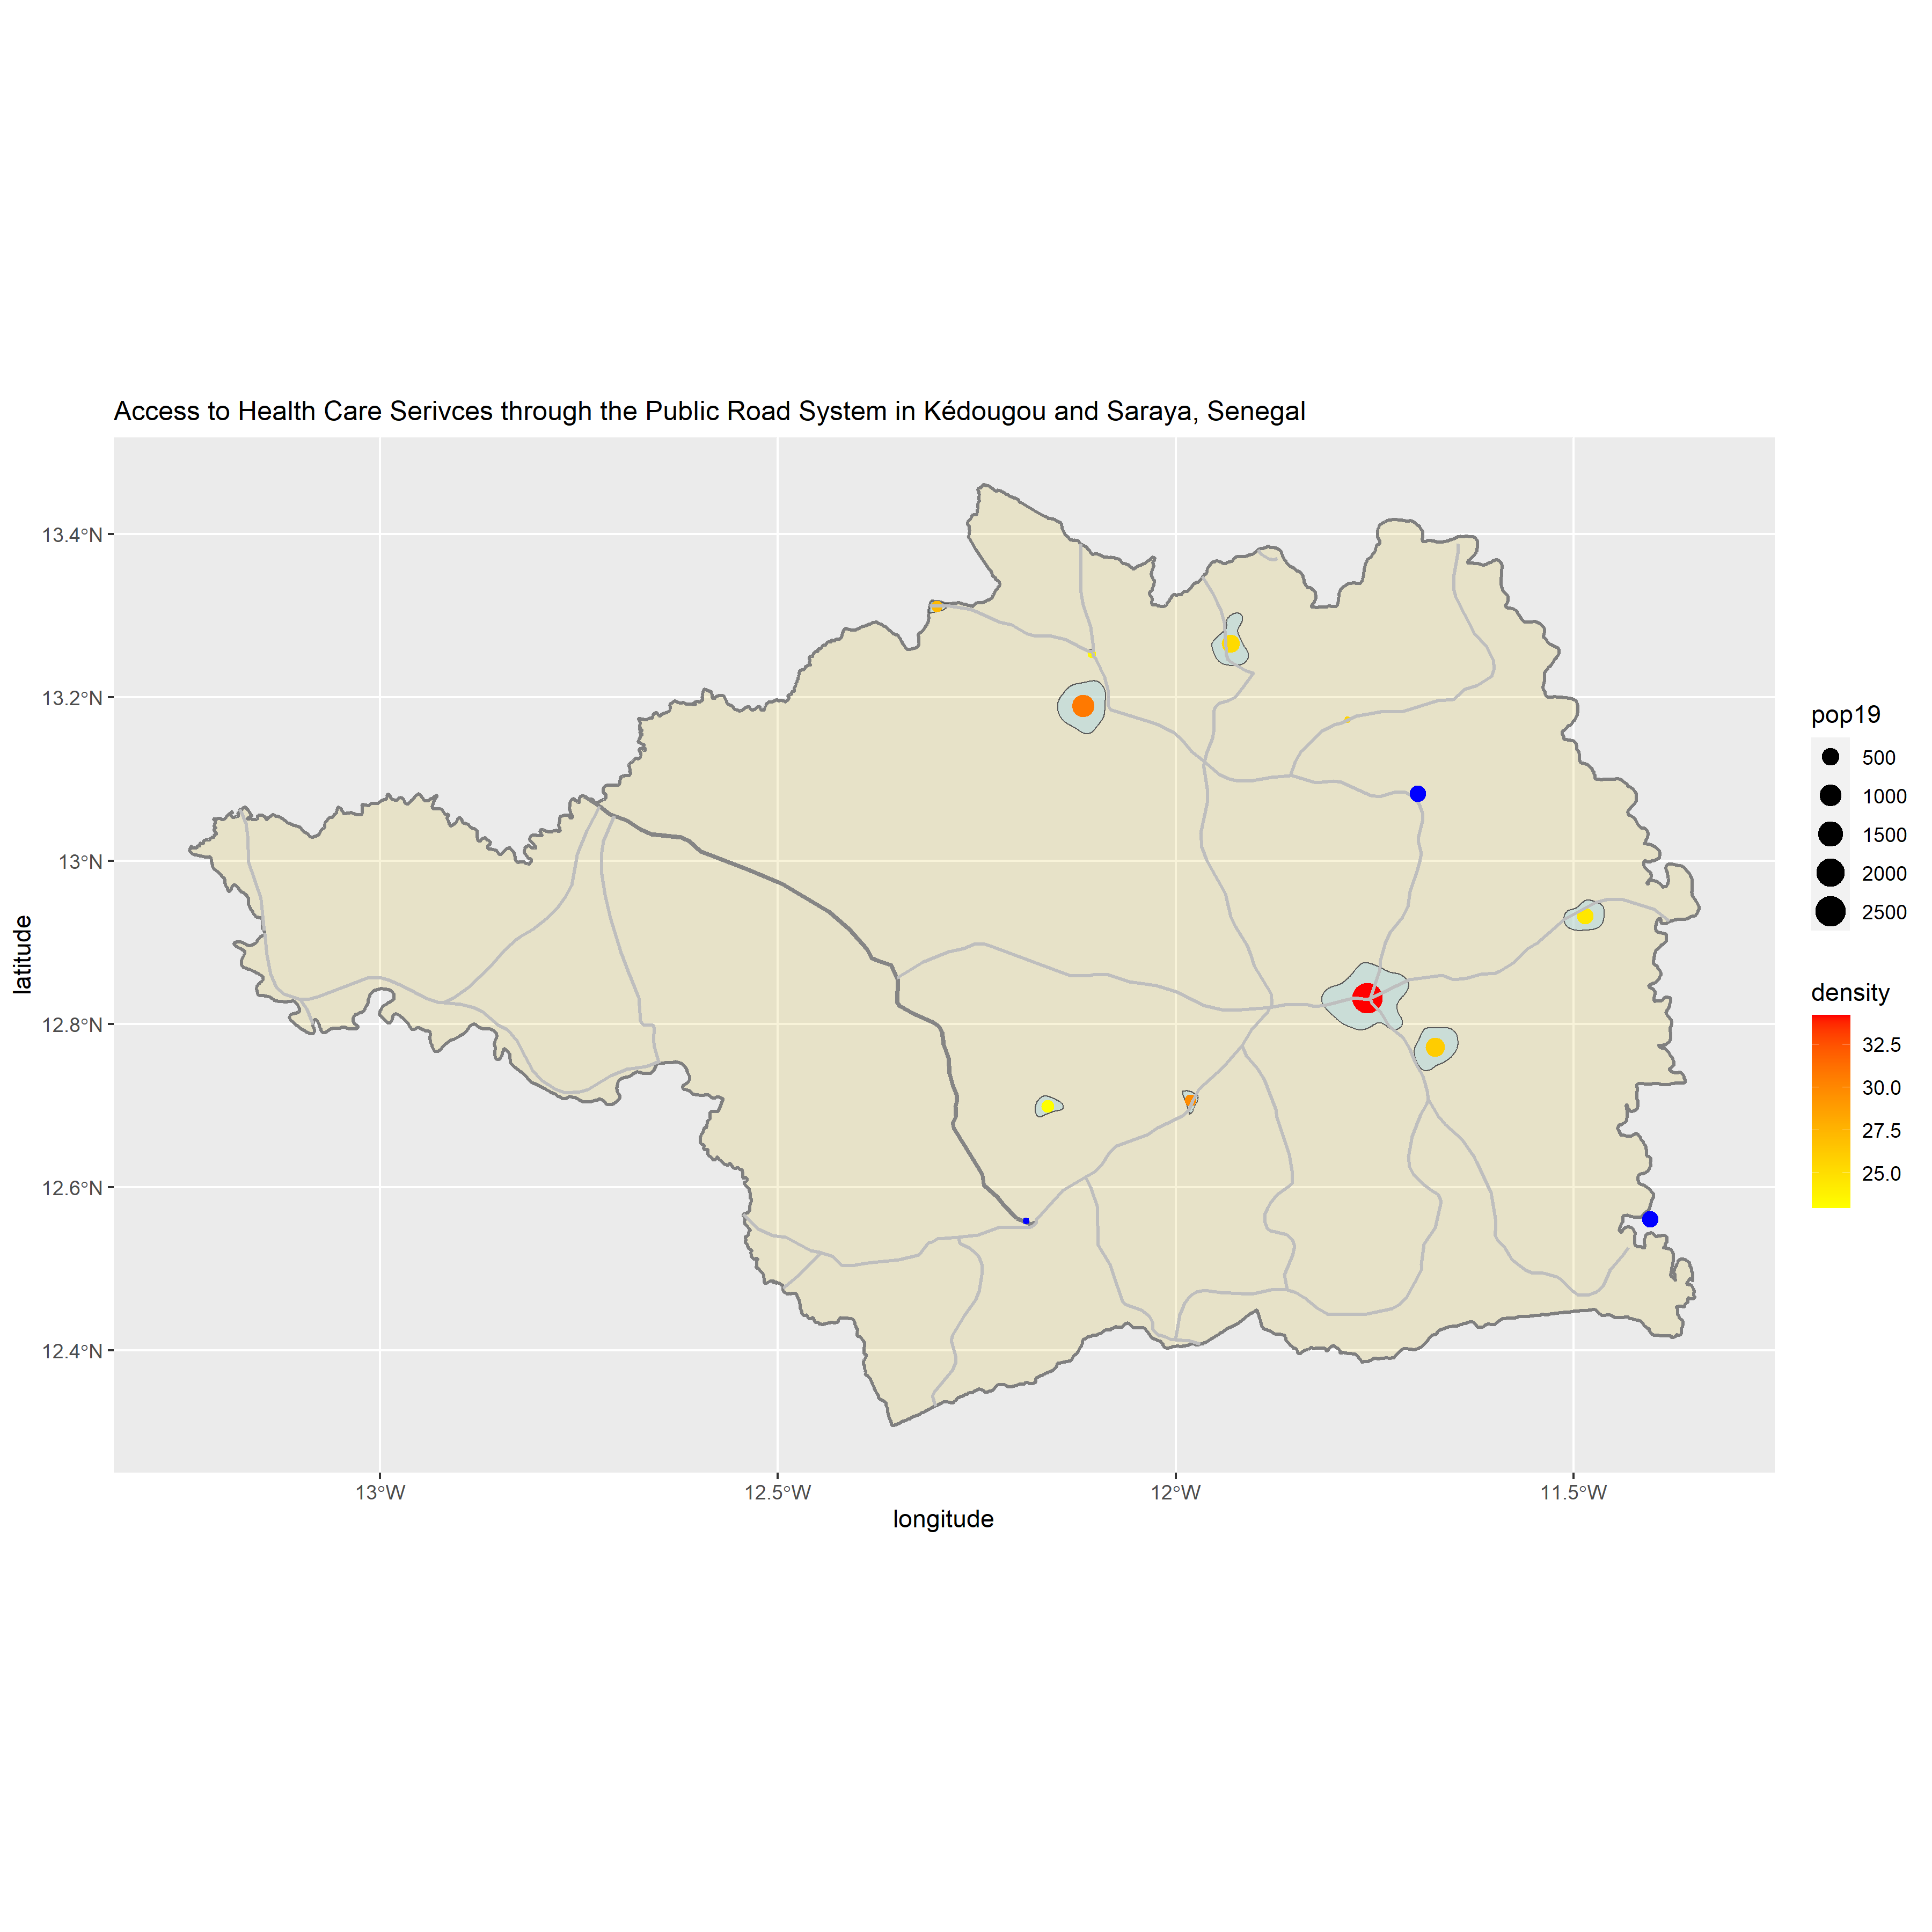
For the final part of this project, I modeled the major public road networks and healthcare facilities across the kedougou and Salaya districts in Senegal’s kedougou region.
This model represents critical accessibility concerns in kedougou and Salaya. My data indicated that there were only three healthcare facilities in the two districts: two hospitals and one pharmacy. Although this is the least populated region of Senegal, the hospitals and pharmacy (indicated by the blue dots) are not near the the most populous settlements. Fortunately, each healthcare facility is located along the main road network. However, kedougou and Salaya seem to be lacking in adequate transportation infrastructure since there is only one primary road system and there is only publically available data about the composition of 5 of those roads–all are concrete roads. This analysis showed me how rural regions in developing countries are especially vulnerable as they may be lacking in adequate transportation and heakthcare access.
