ABM
Sebastian Ruiz's Git Hub repository for ABM at William and Mary
Project maintained by Seabass1000 Hosted on GitHub Pages — Theme by mattgraham
8/26 Extracting Populations from a Raster and Aggregating to each Unit
Challenge
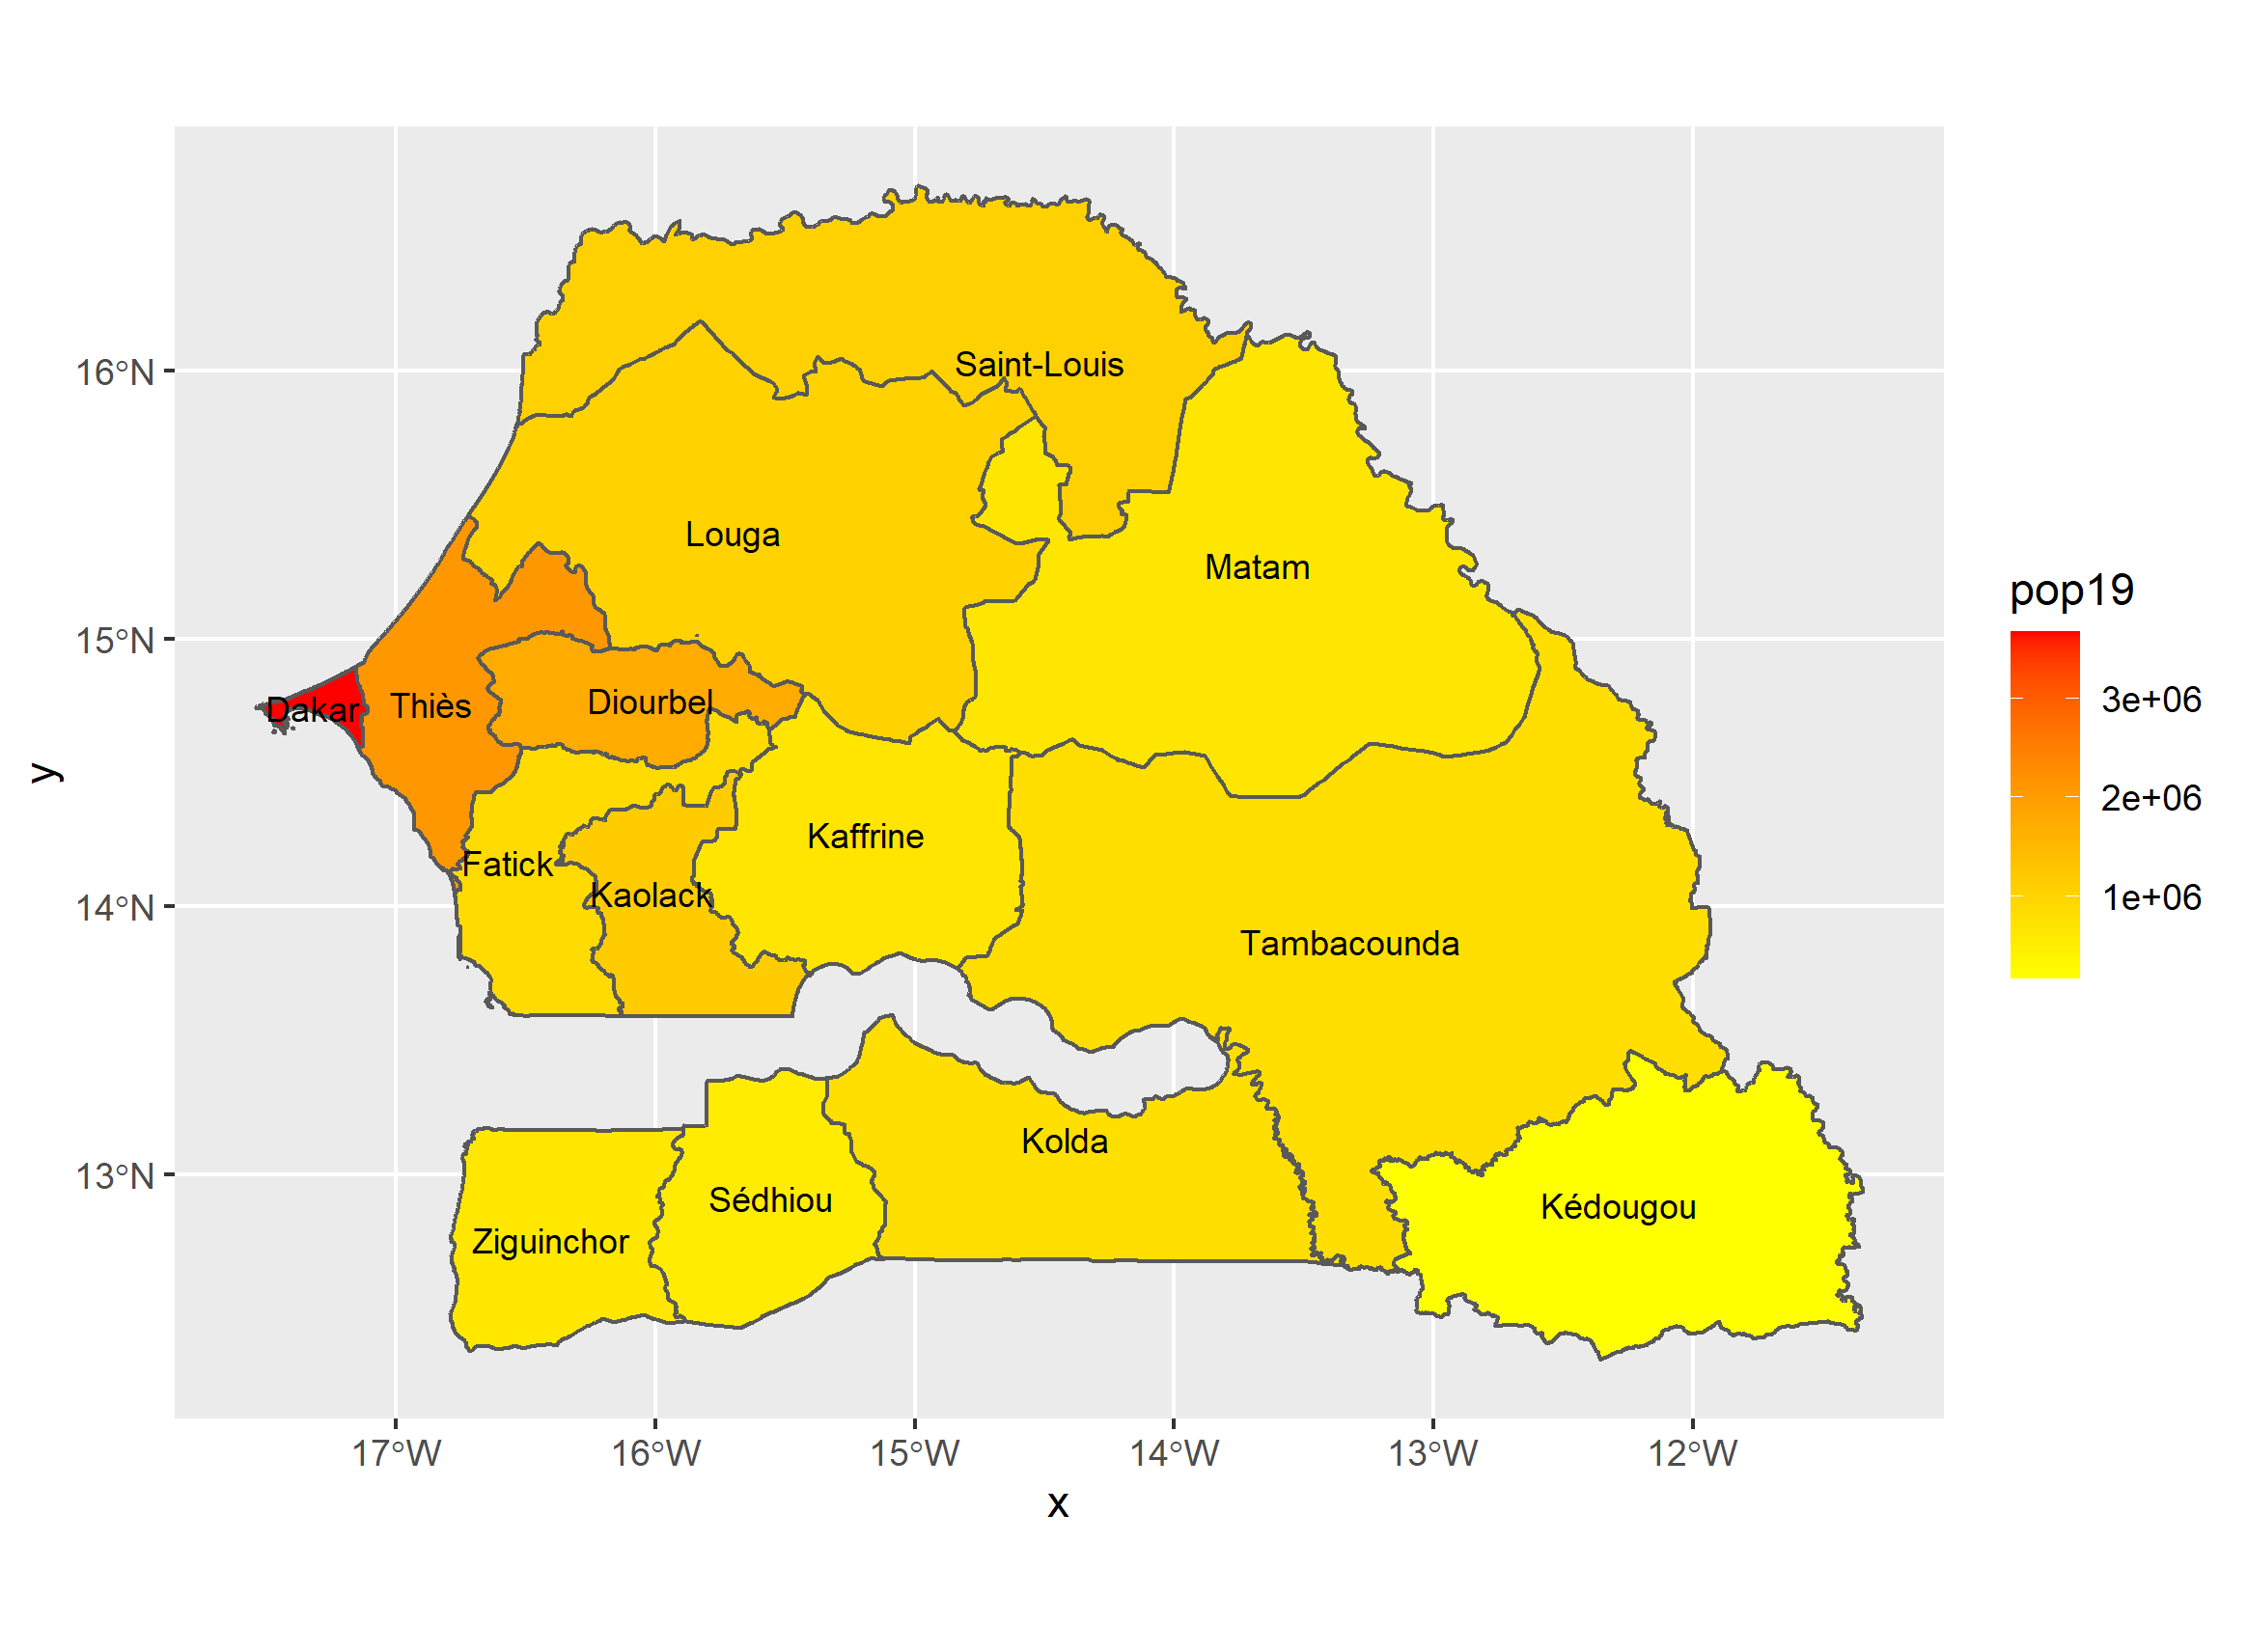
Plot the population distribution of administrative subdivisions of Senegal.

Stretch Goal 1
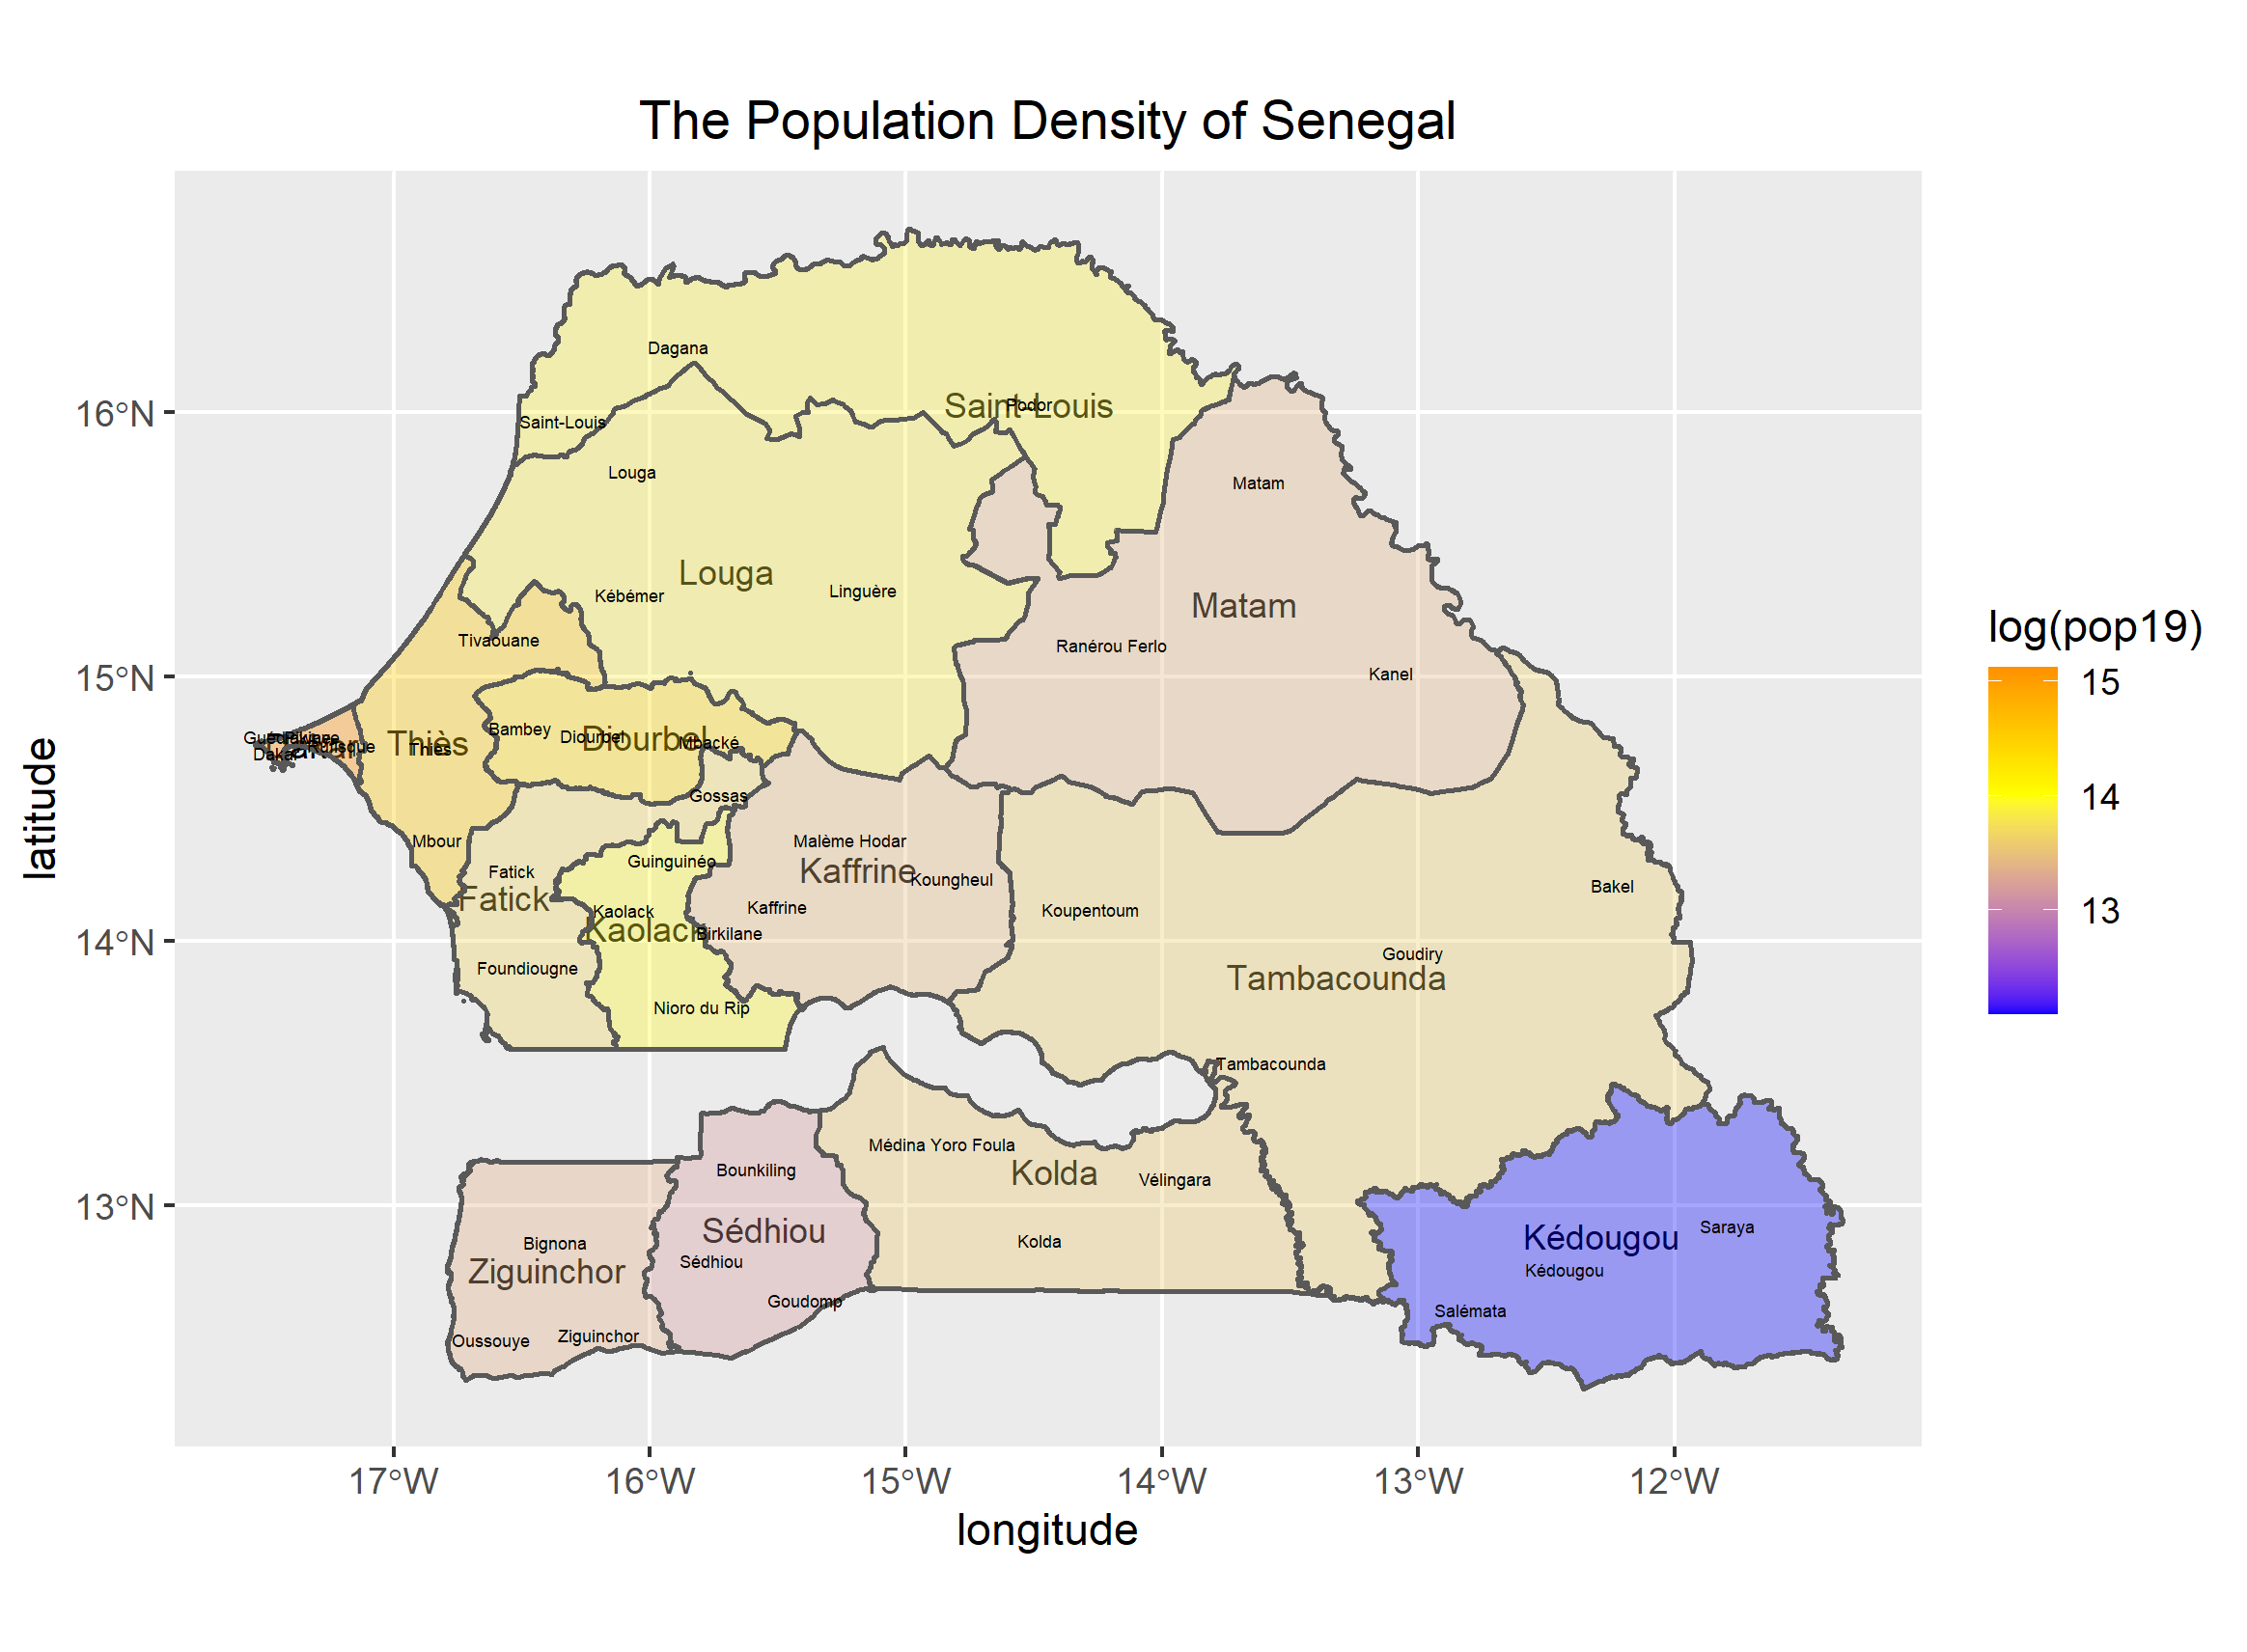
Go back and replicate the step by step instructions from above, but instead of extracting and plotting the values for your LMIC’s adm1 subdivisions, do it for adm2.

Stretch Goal 2
Take your spatial description of population at the district level from above and add the adm1 boundaries, such that you can determine where each district is located.
