ABM
Sebastian Ruiz's Git Hub repository for ABM at William and Mary
Project maintained by Seabass1000 Hosted on GitHub Pages — Theme by mattgraham
9-3 Getting Started with R & R Studio
Task: Plot an individual’s path between homes
Create Variables
x <- 1:10
y <- 10:1
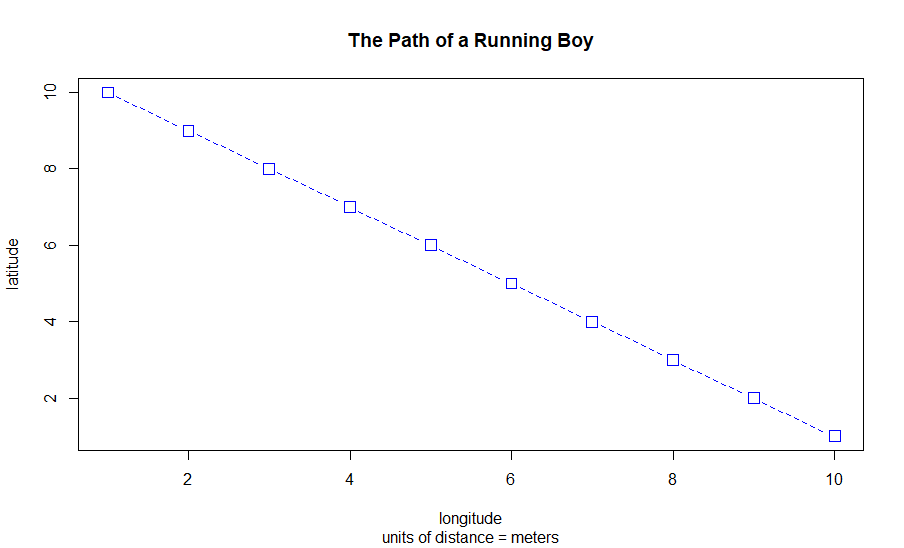
x and y plot
plot(x, y, type = "b", main = "The Path of a Running Boy",
     sub = "units of distance = meters",
     xlab = "longitude",
     ylab = "latitude",
     lty = 2,
     lwd = .75,
     col = "blue",
     pch = 0,
     cex = 1.5)

More advanced and detailed plot between X and Y
x <- 1:100
y <- 1:100
east <- sample(x, size = 10, replace = TRUE)
north <- sample(y, size = 10, replace = TRUE)
symbols(east, north, squares = rep(.75,10), inches = FALSE)
symbols(sample(x, 10, replace = TRUE),
        sample(y, 10, replace = TRUE),
        circles = rep(.75,10),
        inches = FALSE,
        fg = "green",
        add = TRUE)
symbols(east, north, squares = rep(.75,10), inches = FALSE)

symbols(sample(x, 10, replace = TRUE),
        sample(y, 10, replace = TRUE),
        circles = rep(.75,10),
        inches = FALSE,
        fg = "green1",
        bg = "beige",
        add = TRUE)

symbols(sample(x, 10, replace = TRUE),
        sample(y, 10, replace = TRUE),
        circles = rep(1.5,10),
        inches = FALSE,
        fg = "green4",
        bg = "beige",
        add = TRUE)
dwellings <- cbind.data.frame(id = 1:10, east, north)
locs <- sample(1:10, 3, replace = FALSE)
#lines(x = dwellings[locs, 2],
      y = dwellings[locs, 3],
      lty = 2,
      lwd = .75,
      col = "blue")
# text(x = dwellings$east,
#      y = dwellings$north + 3,
#      labels = dwellings$id)

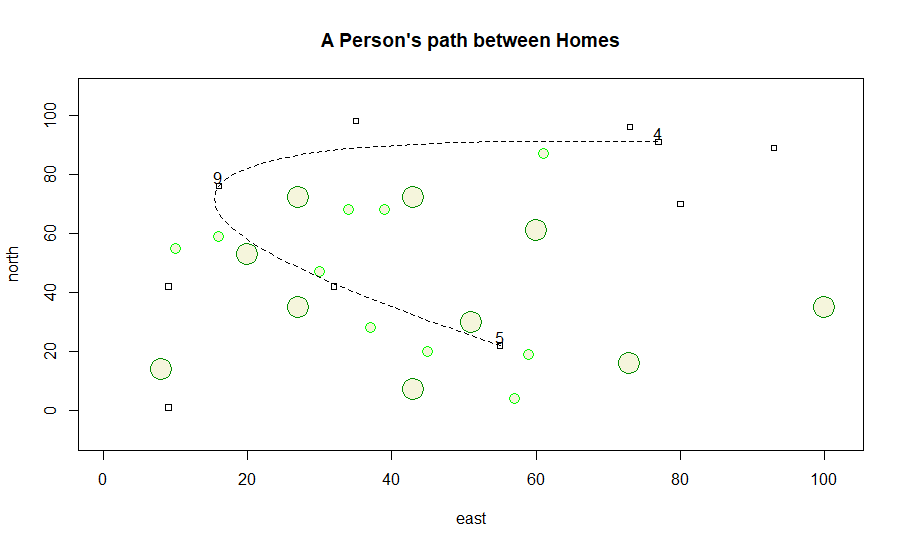
text(x = dwellings[locs, ]$east,
     y = dwellings[locs, ]$north + 3,
     labels = dwellings[locs, ]$id)
xspline(x = dwellings[locs, 2],
        y = dwellings[locs, 3],
        shape = -1,
        lty = 2)
title(main="A Person's path between Homes")

Challenge
text(x = dwellings[locs, ]$east,
     y = dwellings[locs, ]$north + 3,
     labels = dwellings[locs, ]$id)
xspline(x = dwellings[locs, 2],
        y = dwellings[locs, 3],
        shape = -1,
        lty = 2)
title(main="A Person's path between Homes")
x<- 1:1000
y<- 1000:1
east <- sample(x, 50, replace = TRUE)
north <- sample(y, 50, replace = TRUE )
df <- cbind.data.frame(id=1:50, east, north)
symbols(east,north, squares = rep(10,50),inches = FALSE,fg='black')
symbols(sample(x,40,replace = FALSE),
        sample(y,40,replace = FALSE),
        circle=rep(10,40),
        inches = FALSE,
        fg='green',
        bg='beige',
        add=T)
symbols(sample(x,12,replace = FALSE),
        sample(y,12,replace = FALSE),
        circle=rep(20,12),
        fg='green',
        bg='beige',
        inches = FALSE ,
        add = TRUE)
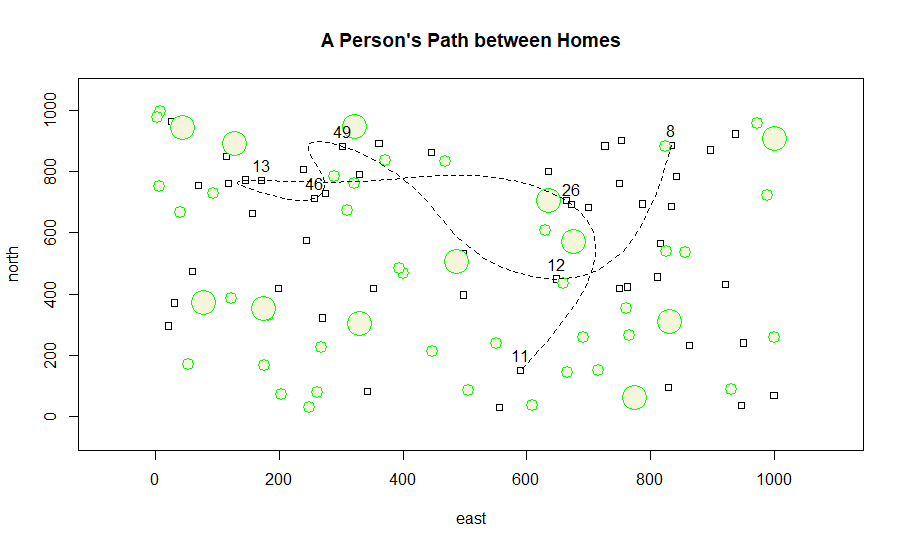
homes <- sample(df$id, 7, replace=F)
xspline(x = df[homes,2],
        y = df[homes,3],
        shape = -1,
        lty = 2)
text(x = df[homes,2],
     y = df[homes,3]+50,
     labels=df[homes,1])
title(main = "A Person's Path between Homes")
